Chart the Northwest Passage with Geomagnetic Modeling
The Northwest Passage is a sea route along the coast of North America that connects the northern Atlantic and Pacific Oceans. It was discovered in 1850 and first navigated by explorer Roald Amundsen in 1903–1906. Navigating the Northwest Passage using a traditional magnetic compass is challenging due to large differences between magnetic and true north at high latitudes. This example charts the Northwest Passage using GeomagneticModelData to return current magnetic field data for the Earth.
Begin with a list of latitude-longitude pairs describing the Northwest Passage and obtain the position of geomagnetic north.
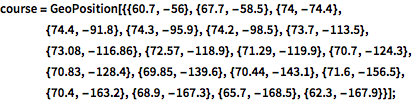
course = GeoPosition[{{60.7, -56}, {67.7, -58.5}, {74, -74.4}, {74.4, \
-91.8}, {74.3, -95.9}, {74.2, -98.5}, {73.7, -113.5}, {73.08, \
-116.86}, {72.57, -118.9}, {71.29, -119.9}, {70.7, -124.3}, {70.83, \
-128.4}, {69.85, -139.6}, {70.44, -143.1}, {71.6, -156.5}, {70.4, \
-163.2}, {68.9, -167.3}, {65.7, -168.5}, {62.3, -167.9}}];geomagneticNorthLocation =
GeomagneticModelData["NorthGeomagneticPole"]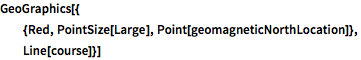
GeoGraphics[{
  {Red, PointSize[Large], Point[geomagneticNorthLocation]},
  Line[course]}]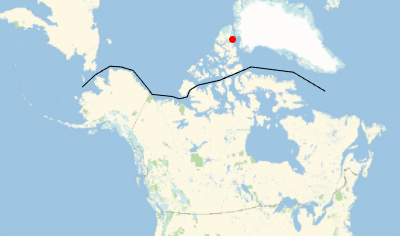
Define a function to plot the direction to the geomagnetic north pole (in red) and local compass reading (in blue).
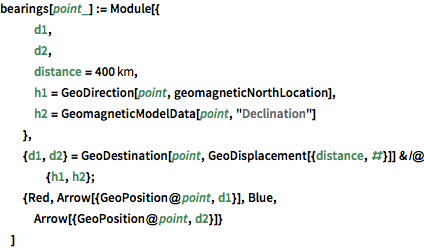
bearings[point_] := Module[{
d1,
d2,
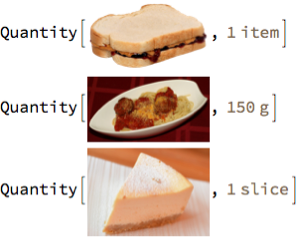
distance = Quantity[400, "Kilometers"],
h1 = GeoDirection[point, geomagneticNorthLocation],
h2 = GeomagneticModelData[point, "Declination"]
},
{d1, d2} =
GeoDestination[point, GeoDisplacement[{distance, #}]] & /@ {h1, h2};
{Red, Arrow[{GeoPosition@point, d1}], Blue,
Arrow[{GeoPosition@point, d2}]}
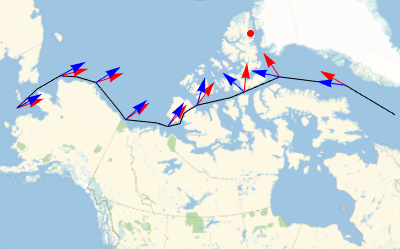
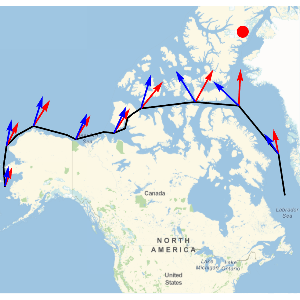
]Pick a reasonably well-spaced set of sample points, compute, and visually observe the differences between true (red) and magnetic (blue) bearings along the Passage.
samplepoints = course[[All, {2, 3, 4, 7, 11, 13, 15, 17, 19}]];GeomagneticModelData[#, "Declination"] & /@ Thread[samplepoints]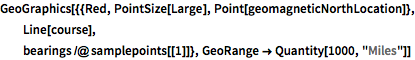
GeoGraphics[{{Red, PointSize[Large], Point[geomagneticNorthLocation]},
   Line[course],
  bearings /@ samplepoints[[1]]}, GeoRange -> Quantity[1000, "Miles"]]