ポケモンパワー
Wolfram Knowledgebaseは,科学知識だけでなく人気のある人物や物事についての情報も有している.ここでは,組込みの実体フレームワークを使って,いろいろなポケモンのさまざまな物理的特徴(攻撃・防御点,体重,色)が研究,比較,可視化されている.
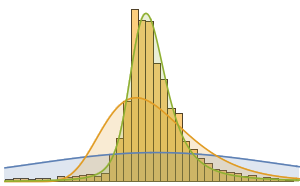
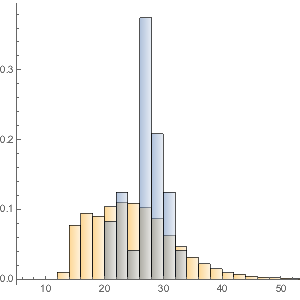
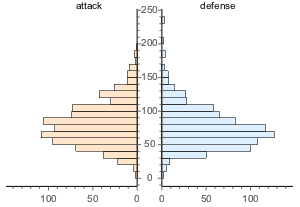
すべてのポケモンの攻撃点と防御点の分布をプロットする.
In[1]:=
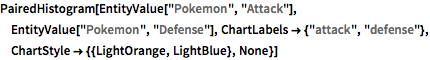
PairedHistogram[EntityValue["Pokemon", "Attack"],
 EntityValue["Pokemon", "Defense"],
 ChartLabels -> {"attack", "defense"},
 ChartStyle -> {{LightOrange, LightBlue}, None}]
Out[1]=
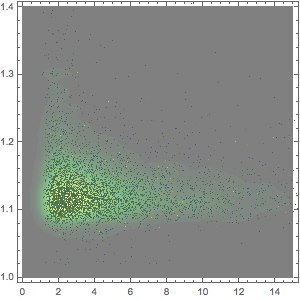
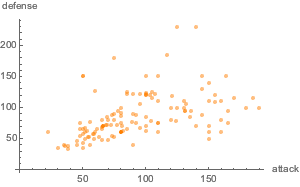
第6世代ポケモンの攻撃点と防御点のDatasetを作り,プロットする.
In[2]:=
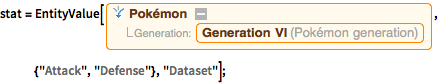
stat = EntityValue[Entity[
   "Pokemon", {
    "Generation" -> Entity[
      "PokemonGeneration", "GenerationVI"]}], {"Attack", "Defense"},
   "Dataset"];
In[3]:=
ListPlot[stat,
 PlotStyle -> Directive[Opacity[0.5], Orange, PointSize[Medium]],
 AxesLabel -> Automatic, LabelingFunction -> None]
Out[3]=
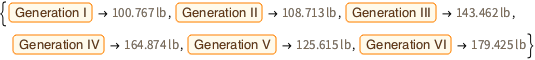
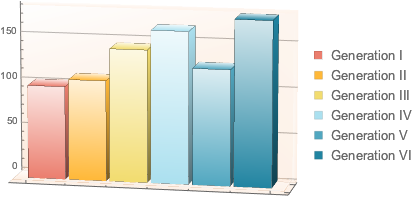
ポケモンの平均体重を世代ごとに比較しプロットする.
In[4]:=
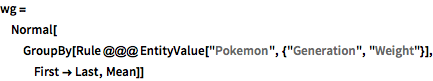
wg = Normal[
  GroupBy[Rule @@@ EntityValue["Pokemon", {"Generation", "Weight"}],
   First -> Last, Mean]]
Out[4]=
In[5]:=
BarChart3D[wg[[All, 2]], ChartLegends -> wg[[All, 1]],
 ChartStyle -> 24]
Out[5]=
隠的に定義された実体クラスを使って最も重いポケモンを3匹求める.
In[6]:=
EntityList[EntityClass["Pokemon", {"Weight" -> TakeLargest[3]}]]Out[6]=
In[7]:=
EntityList[EntityClass["Pokemon", {"Weight" -> TakeLargest[3]}]];
EntityValue[%, "Generation"]
Out[7]=
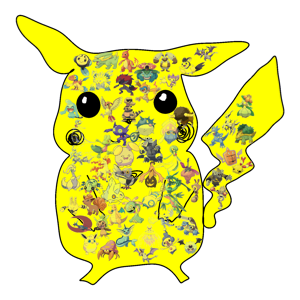
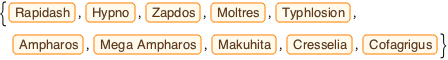
隠的に定義された実体クラスを使って重さが50Kgから100Kgまでの黄色いポケモンを求める.
In[8]:=
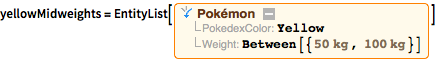
yellowMidweights = EntityList[
Entity["Pokemon", {"PokedexColor" -> "Yellow", "Weight" -> Between[{
Quantity[50, "Kilograms"],
Quantity[100, "Kilograms"]}]}]]
Out[8]=
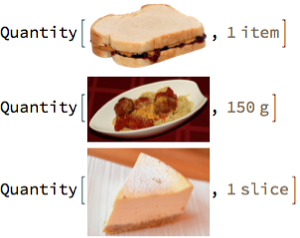
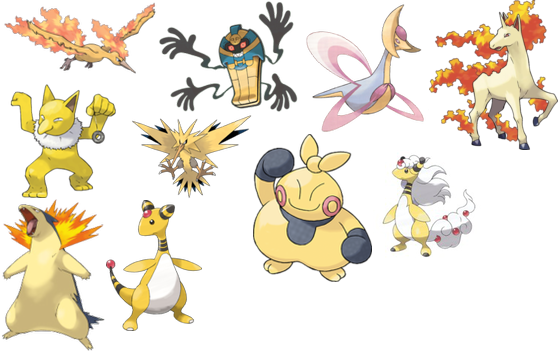
これらのポケモンのコラージュを重さに基づいた大きさで作る.
In[9]:=
ImageCollage[
 Rule @@@ EntityValue[yellowMidweights, {"Weight", "Image"}],
 Background -> White]
Out[9]=
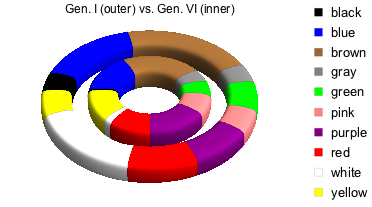
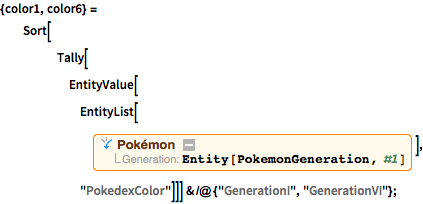
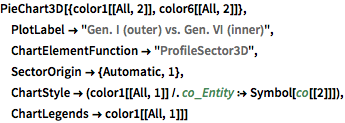
オリジナルグループ(第1世代)のポケモンと最新グループ(第6世代)のポケモンの色を比較する.
完全なWolfram言語入力を表示する
Out[11]=