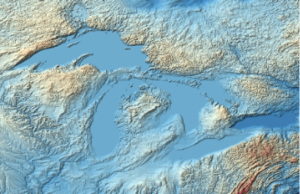
인터넷 소스에서 가져온 데이터
오대호 과거 1년의 매일 평균 기온을 다운로드합니다.
In[1]:=
rawdata =
Import["http://coastwatch.glerl.noaa.gov/ftp/glsea/avgtemps/glsea-\
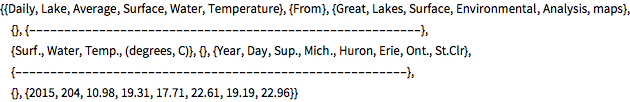
temps_1024.dat", "Data"];관측은 11행부터 시작합니다.
In[2]:=
rawdata[[;; 11]]Out[2]=
In[3]:=
obs = rawdata[[11 ;;]];관측 횟수를 알아봅니다.
In[4]:=
Length[obs]Out[4]=
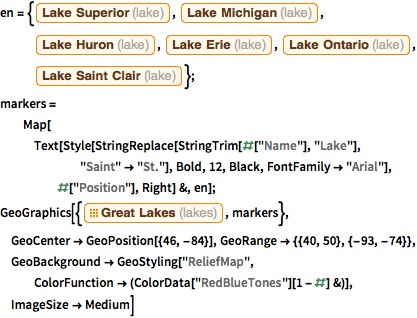
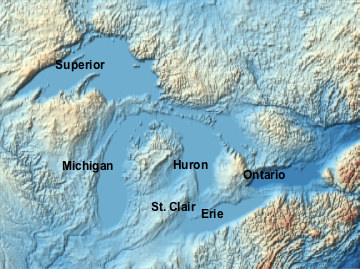
호수의 목록을 정의합니다.
In[5]:=
lakes = {"Superior", "Michigan", "Huron", "Erie", "Ontario",
   "St. Clair"};
전체 Wolfram 언어 입력 표시하기
Out[6]=
TimeSeries의 타임 스탬프로 사용될 날짜를 생성합니다.
In[7]:=
dates = Table[
   DatePlus[{obs[[k, 1]], 1, 1}, Quantity[obs[[k, 2]], "Days"]], {k,
1, Length[obs]}];QuantityArray를 사용하여 기온과 단위를 저장합니다.
In[8]:=
values = QuantityArray[obs[[All, 3 ;;]], "DegreesCelsius"]Out[8]=
호수의 목록은 예를 들어 나중에 플롯 범례를 만드는 등 꺼내 사용할 수있는 MetaInformation로 저장합니다.
In[9]:=
ts = TimeSeries[values, {dates},
  MetaInformation -> {"Lakes" -> lakes}]
Out[9]=
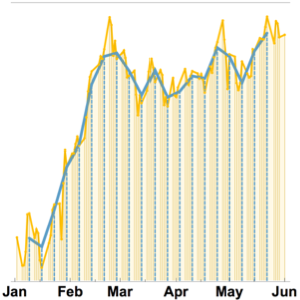
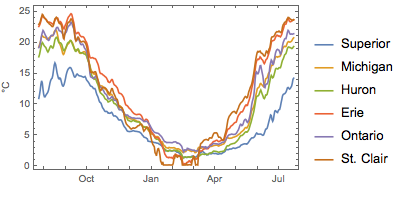
In[10]:=
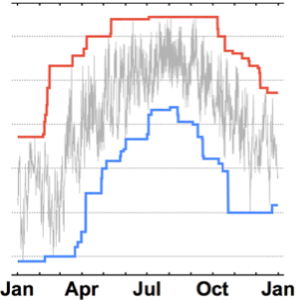
DateListPlot[ts, PlotLegends -> ts["Lakes"], PlotTheme -> "Detailed",
 FrameLabel -> Automatic]
Out[10]=
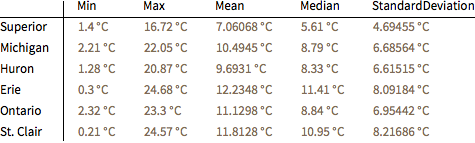
각 호수의 기술 통계량을 조사합니다.
In[11]:=
stats = {Min, Max, Mean, Median, StandardDeviation};
summary[lake_] := Map[#[lake] &, stats]
In[12]:=
TableForm[
 Table[summary[ts["PathComponent", k]], {k, 1, Length[lakes]}],
 TableHeadings -> {lakes, stats}]
Out[12]//TableForm=