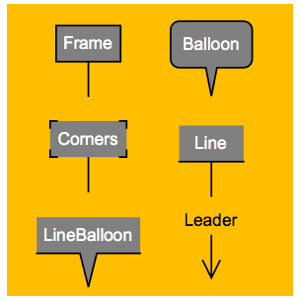
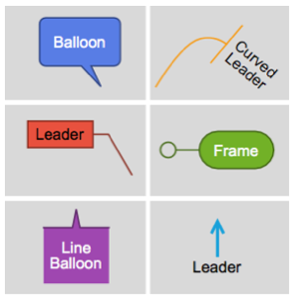
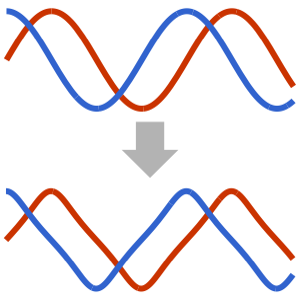
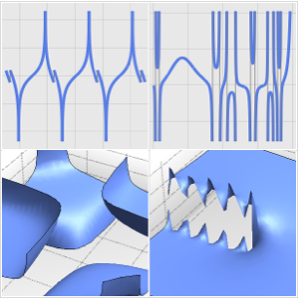
Leader Lines in Callouts
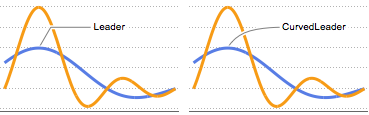
Assign a curved leader.
In[1]:=
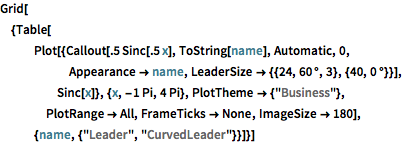
Grid[{Table[
   Plot[{Callout[.5 Sinc[.5 x], ToString[name], Automatic, 0,
      Appearance -> name,
      LeaderSize -> {{24, 60 \[Degree], 3}, {40, 0 \[Degree]}}],
     Sinc[x]}, {x, -1 Pi, 4 Pi}, PlotTheme -> {"Business"},
    PlotRange -> All, FrameTicks -> None,
    ImageSize -> 180], {name, {"Leader", "CurvedLeader"}}]}]
Out[1]=
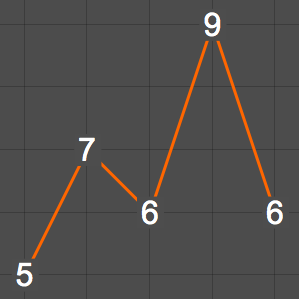
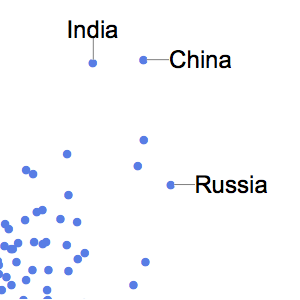
Specify the length of a leader.
In[2]:=
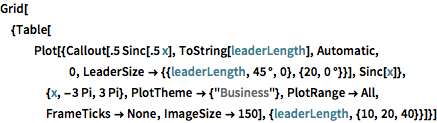
Grid[{Table[
   Plot[{Callout[.5 Sinc[.5 x], ToString[leaderLength], Automatic, 0,
      LeaderSize -> {{leaderLength, 45 \[Degree], 0}, {20,
         0 \[Degree]}}], Sinc[x]}, {x, -3 Pi, 3 Pi},
    PlotTheme -> {"Business"}, PlotRange -> All, FrameTicks -> None,
    ImageSize -> 150], {leaderLength, {10, 20, 40}}]}]
Out[2]=
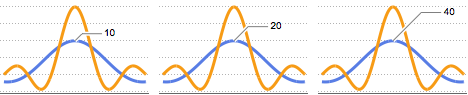
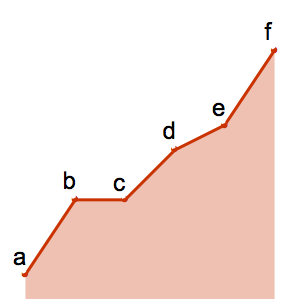
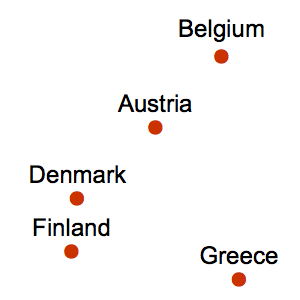
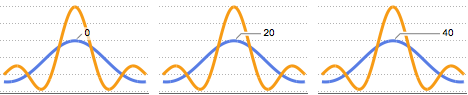
Specify the length of the neck.
In[3]:=
Grid[{Table[
   Plot[{Callout[.5 Sinc[.5 x], ToString[neckLength], Automatic, 0,
      LeaderSize -> {{10, 45 \[Degree], 3}, {neckLength,
         0 \[Degree]}}], Sinc[x]}, {x, -3 Pi, 3 Pi},
    PlotTheme -> {"Business"}, PlotRange -> All, FrameTicks -> None,
    ImageSize -> 150], {neckLength, {0, 20, 40}}]}]
Out[3]=
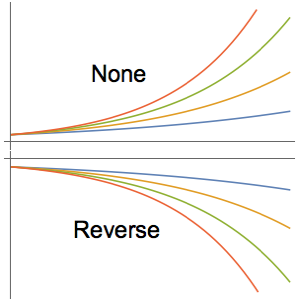
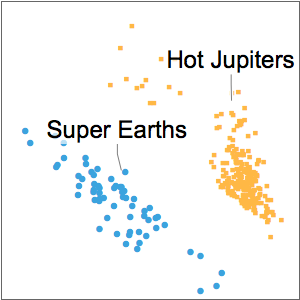
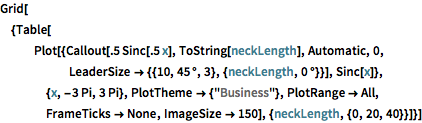
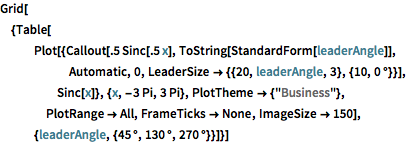
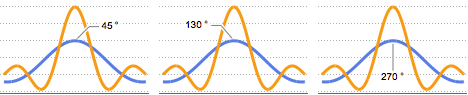
Specify the angle of a leader.
In[4]:=
Grid[{Table[
   Plot[{Callout[.5 Sinc[.5 x], ToString[StandardForm[leaderAngle]],
      Automatic, 0,
      LeaderSize -> {{20, leaderAngle, 3}, {10, 0 \[Degree]}}],
     Sinc[x]}, {x, -3 Pi, 3 Pi}, PlotTheme -> {"Business"},
    PlotRange -> All, FrameTicks -> None,
    ImageSize -> 150], {leaderAngle, {45 \[Degree], 130 \[Degree],
     270 \[Degree]}}]}]
Out[4]=
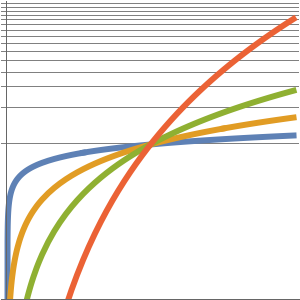
Specify the angle of the neck.
In[5]:=
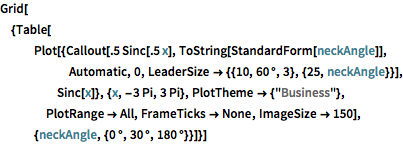
Grid[{Table[
   Plot[{Callout[.5 Sinc[.5 x], ToString[StandardForm[neckAngle]],
      Automatic, 0,
      LeaderSize -> {{10, 60 \[Degree], 3}, {25, neckAngle}}],
     Sinc[x]}, {x, -3 Pi, 3 Pi}, PlotTheme -> {"Business"},
    PlotRange -> All, FrameTicks -> None,
    ImageSize -> 150], {neckAngle, {0 \[Degree], 30 \[Degree],
     180 \[Degree]}}]}]
Out[5]=
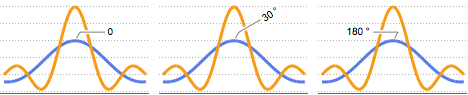
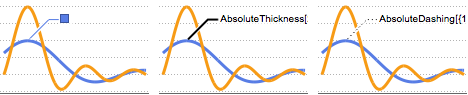
Style the leader.
In[6]:=
Grid[{Table[
   Plot[{Callout[.5 Sinc[.5 x], ToString[StandardForm[style]],
      Automatic, 0,
      LeaderSize -> {{30, 45 \[Degree], 3}, {10, 0 \[Degree]}},
      CalloutStyle -> style], Sinc[x]}, {x, -1 Pi, 5 Pi},
    PlotTheme -> {"Business"}, PlotRange -> All, FrameTicks -> None,
    ImageSize -> 150], {style, {RGBColor[0.34398, 0.49112, 0.89936],
     AbsoluteThickness[2], AbsoluteDashing[{1, 3}]}}]}]
Out[6]=
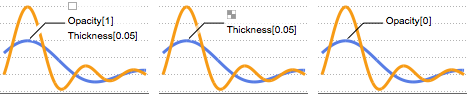
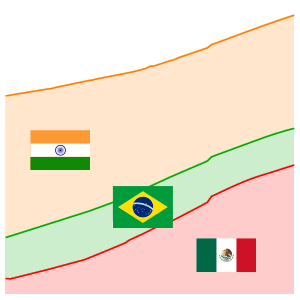
Style the knockout around the leader.
In[7]:=
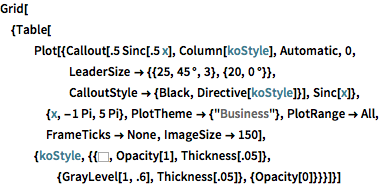
Grid[{Table[
   Plot[{Callout[.5 Sinc[.5 x], Column[koStyle], Automatic, 0,
      LeaderSize -> {{25, 45 \[Degree], 3}, {20, 0 \[Degree]}},
      CalloutStyle -> {Black, Directive[koStyle]}],
     Sinc[x]}, {x, -1 Pi, 5 Pi}, PlotTheme -> {"Business"},
    PlotRange -> All, FrameTicks -> None,
    ImageSize ->
     150], {koStyle, {{GrayLevel[1], Opacity[1],
      Thickness[.05]}, {GrayLevel[1, .6],
      Thickness[.05]}, {Opacity[0]}}}]}]
Out[7]=