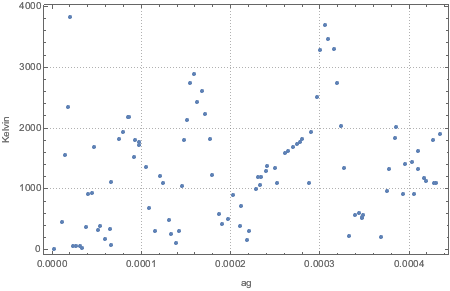
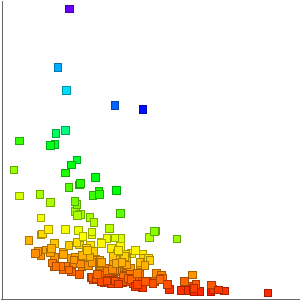
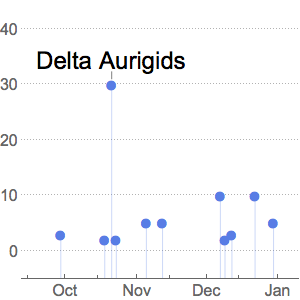
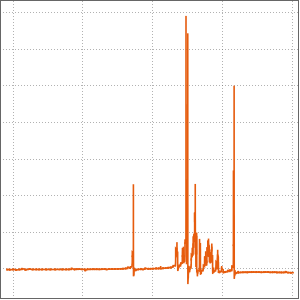
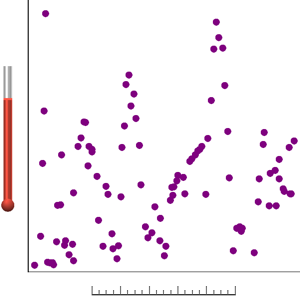
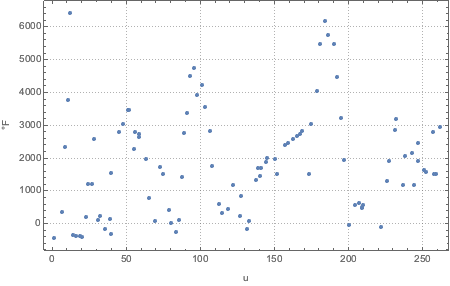
온도 vs. 크기 플롯
다음은 몇 가지 원소의 초기 질량과 융점을 값과 관련 단위의 배열로 나타낸 것입니다.
In[1]:=
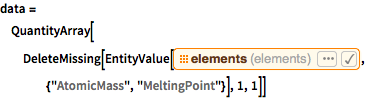
data = QuantityArray[DeleteMissing[EntityValue[\!\(\*
NamespaceBox["LinguisticAssistant",
DynamicModuleBox[{Typeset`query$$ = "elements", Typeset`boxes$$ =
        TemplateBox[{"\"elements\"",
RowBox[{"EntityClass", "[",
RowBox[{"\"Element\"", ",", "\"Elements\""}], "]"}],
          "\"EntityClass[\\\"Element\\\", \\\"Elements\\\"]\"",
          "\"elements\""}, "EntityClass"],
        Typeset`allassumptions$$ = {{
         "type" -> "Clash", "word" -> "elements",
          "template" -> "Assuming \"${word}\" is ${desc1}. Use as \
${desc2} instead", "count" -> "5",
          "Values" -> {{
            "name" -> "ElementClass", "desc" -> "a class of elements",
              "input" -> "*C.elements-_*ElementClass-"}, {
            "name" -> "Book", "desc" -> "a book",
             "input" -> "*C.elements-_*Book-"}, {
            "name" -> "Periodical", "desc" -> "a periodical",
             "input" -> "*C.elements-_*Periodical-"}, {
            "name" -> "MathWorld",
             "desc" -> " referring to a mathematical definition",
             "input" -> "*C.elements-_*MathWorld-"}, {

            "name" -> "Word", "desc" -> "a word",
             "input" -> "*C.elements-_*Word-"}}}},
        Typeset`assumptions$$ = {}, Typeset`open$$ = {1, 2},
        Typeset`querystate$$ = {
        "Online" -> True, "Allowed" -> True,
         "mparse.jsp" -> 0.741312`6.321546023823575,
         "Messages" -> {}}},
DynamicBox[ToBoxes[
AlphaIntegration`LinguisticAssistantBoxes["", 4, Automatic,
Dynamic[Typeset`query$$],
Dynamic[Typeset`boxes$$],
Dynamic[Typeset`allassumptions$$],
Dynamic[Typeset`assumptions$$],
Dynamic[Typeset`open$$],
Dynamic[Typeset`querystate$$]], StandardForm],
ImageSizeCache->{187., {7., 15.}},
TrackedSymbols:>{
          Typeset`query$$, Typeset`boxes$$, Typeset`allassumptions$$,
           Typeset`assumptions$$, Typeset`open$$,
           Typeset`querystate$$}],
DynamicModuleValues:>{},
UndoTrackedVariables:>{Typeset`open$$}],
BaseStyle->{"Deploy"},
DeleteWithContents->True,
Editable->False,
SelectWithContents->True]\), {"AtomicMass", "MeltingPoint"}], 1, 1]]
Out[1]=
데이터를 플롯하고 축 단위의 라벨을 붙입니다.
In[2]:=
ListPlot[data, PlotTheme -> "Detailed", FrameLabel -> Automatic,
 ImageSize -> 450]
Out[2]=
아토그램과 켈빈으로 데이터를 플롯합니다.
In[3]:=
ListPlot[data, PlotTheme -> "Detailed", FrameLabel -> Automatic,
 ImageSize -> 450, TargetUnits -> {"Attograms", "Kelvin"}]
Out[3]=