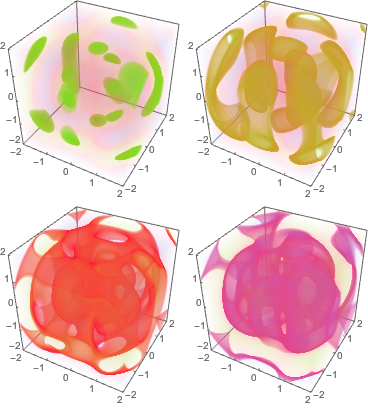
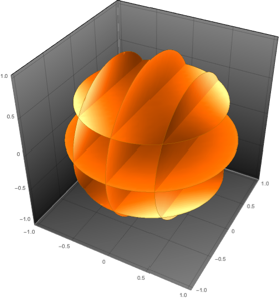
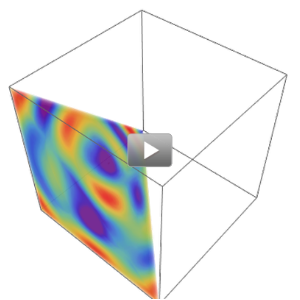
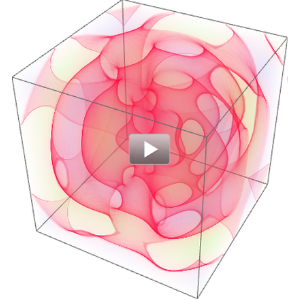
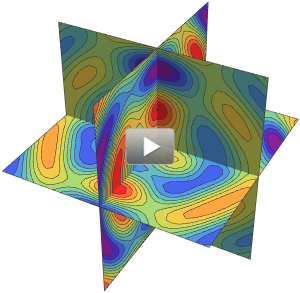
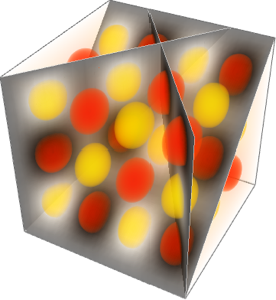
Use Opacity to See Function
Focus on different structures in a volume by giving the interval of values that should be the most opaque.
show complete Wolfram Language input
In[2]:=
func = Sum[
   Cos[5 Norm[{x, y, z} - {Sin[\[Theta]], Cos[\[Theta]],
        0}]], {\[Theta], 0., 2 \[Pi] - (2 \[Pi])/3, (2 \[Pi])/3}];
In[3]:=
Grid[Partition[
  Table[DensityPlot3D[func, {x, -2, 2}, {y, -2, 2}, {z, -2, 2},
    OpacityFunction -> Interval[{a, a + .1}], ColorFunction -> cf,
    PlotTheme -> "Web"], {a, 0, .9, .2}], 2]]