Carbon Atomic Transitions within the Visible Spectrum
SpectralLineData provides information about atomic states and state transitions, including wavelength.
Get a list of state transitions in neutral carbon for wavelengths between 400 and 550 nanometers.
Check the wavelength of the first of these transitions.
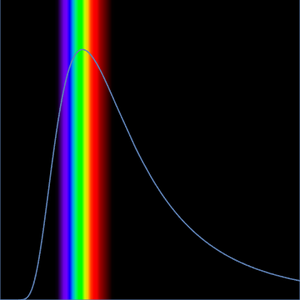
By extracting the wavelength for carbon transitions within a certain range, one can then visualize the transitions on the visible spectrum.
Extract the upper and lower levels for each transition.
A wealth of information can be obtained for each atomic level.
Gather energy information for each atomic level.
Determine the colors for each transition.
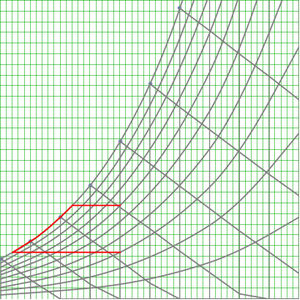
Plot each transition in terms of the energy levels of the initial and final atomic levels.
show complete Wolfram Language input