增强的可视化
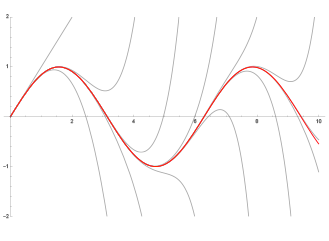
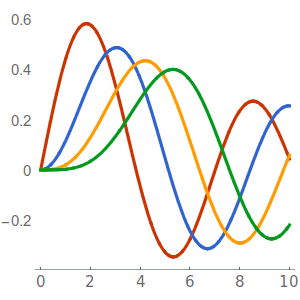
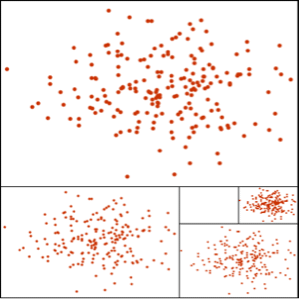
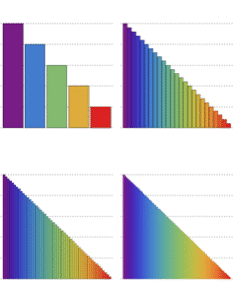
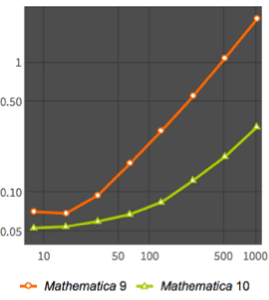
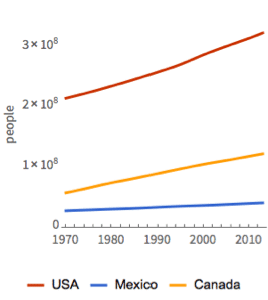
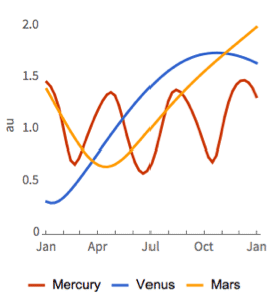
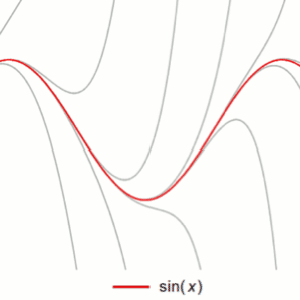
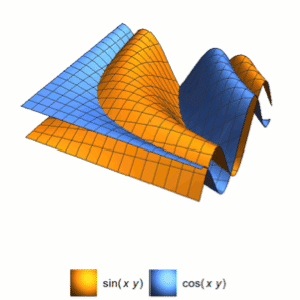
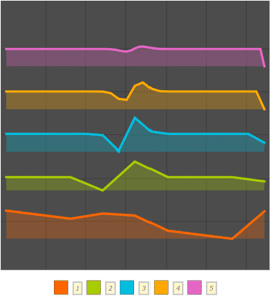
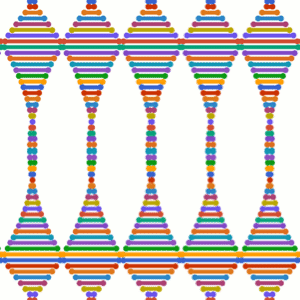
Version 10 refreshes the overall aesthetic for visualizations, combining a bolder, unified color scheme across all visualization functions, with new automatic computation of visual attributes such as point sizes, edge styles, surface colors, and axes positioning. Besides the default appearance, a whole set of themes easily and automatically changes how plots look for a variety of situations and uses. The visualization functions are also extended to automatically work on time series, associated arrays, and data with units.
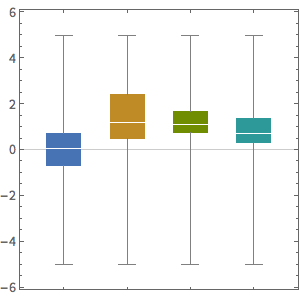
- 全部可视化函数应用新的配色方案.
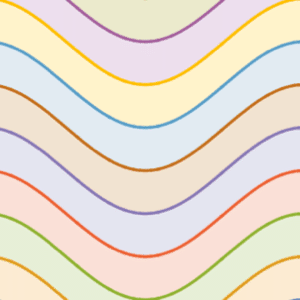
- 绘图主题可轻松改变图的外观和关注点.
- 根据数据集的大小和分布自动选择点的大小.
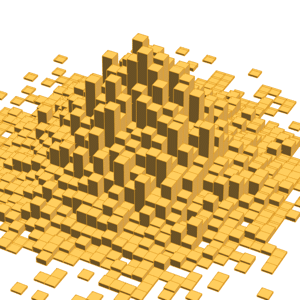
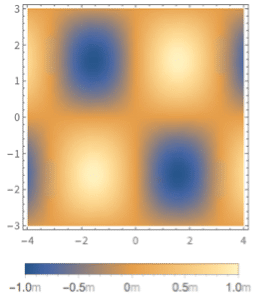
- 独特的曲面绘图样式.
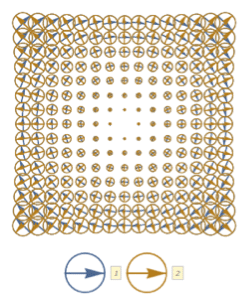
- 为色觉障碍者使用的更好的对比色.
- 填充样式自动遵循主绘图样式.
- 直方图中的条形图边缘随密度的增减自动淡出.
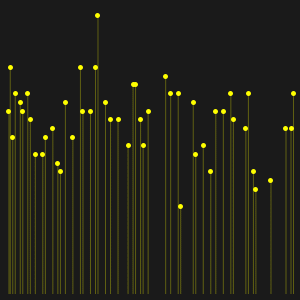
- 对大型和复杂点集的快速渲染.
- 对向量和流的绘图,以及其他特殊可视化添加了自动图例构建.
- 自动使用关联数组的键名作为图例标签,直接对数据绘图.
- 直接对时间和事件序列绘图.
- 在统计绘图中使用带有相关权重的数据.
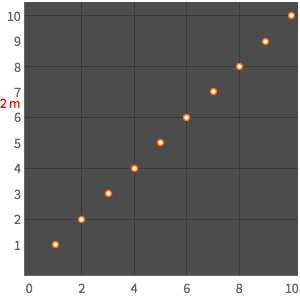
- 对有单位的数据或函数的绘图自动检测并转换单位.
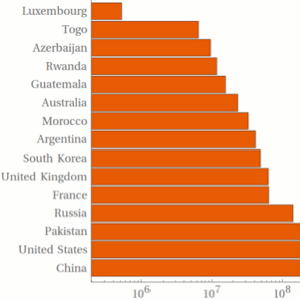
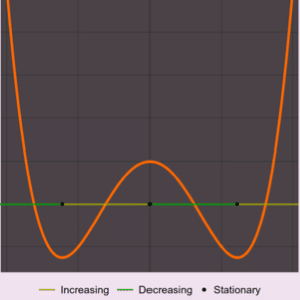
- 对数轴上的值、范围和不等式绘图.
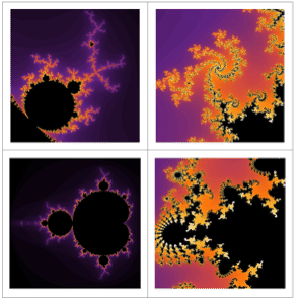
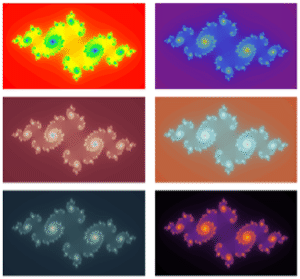
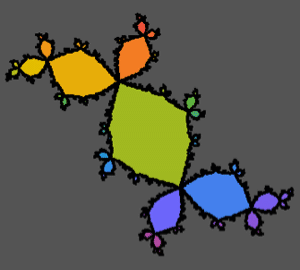
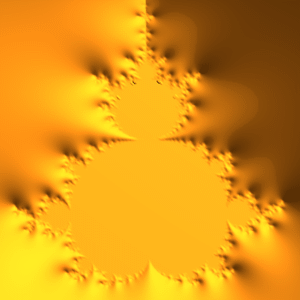
- 可视化曼德博(Mandelbrot)集合与和朱利亚(Julia)集合.
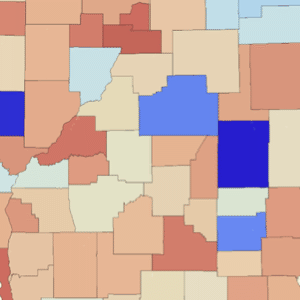
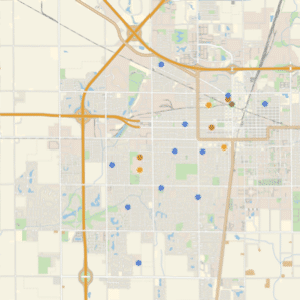
- 用各种显式或隐式,在地图上绘制位置.
- 根据相关值对地图区域着色.
Related Examples
 New Default Styles »
 Improved Styles for Color Vision Impairment »
 Use Plot Themes to Customize Plots »
 Adaptive Point Size Selection »
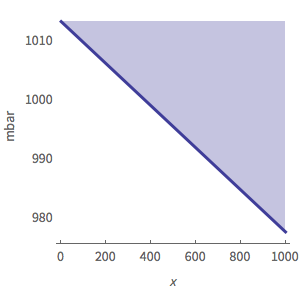 Plot Functions Using Units »
 Units Improvement »
 Units for Legends »
 Use Weighted Data Instead of a Full Dataset »
 Plot Time and Event Series »
 Plot Keys and Values from Associations »
 Plot Values from Associations »
 Use Combinations of Wrappers »
相关函数PlotTheme  TimeSeries EventSeries Quantity Association WeightedData ArrayPlot BodePlot ChromaticityPlot CommunityGraphPlot ContourPlot DateListLogPlot DateListPlot DensityPlot DiscretePlot GeoListPlot GeoRegionValuePlot GraphPlot JuliaSetPlot LayeredGraphPlot LineIntegralConvolutionPlot ListContourPlot ListCurvePathPlot ListDensityPlot ListLineIntegralConvolutionPlot ListLinePlot ListLogLinearPlot ListLogLogPlot ListLogPlot ListPlot ListPolarPlot ListStreamDensityPlot ListStreamPlot ListVectorDensityPlot ListVectorPlot LogLinearPlot LogLogPlot LogPlot MandelbrotSetPlot MatrixPlot NicholsPlot NumberLinePlot NyquistPlot ParametricPlot Plot PolarPlot ProbabilityPlot ProbabilityScalePlot QuantilePlot RegionPlot ReliefPlot RootLocusPlot SingularValuePlot StreamDensityPlot StreamPlot TreePlot VectorDensityPlot VectorPlot WaveletImagePlot WaveletListPlot WaveletMatrixPlot ChromaticityPlot3D ContourPlot3D DiscretePlot3D GraphPlot3D ListContourPlot3D ListPlot3D ListPointPlot3D ListSurfacePlot3D ListVectorPlot3D ParametricPlot3D Plot3D RegionPlot3D RevolutionPlot3D SphericalPlot3D VectorPlot3D BarChart BoxWhiskerChart BubbleChart CandlestickChart DistributionChart InteractiveTradingChart KagiChart LineBreakChart PairedBarChart PieChart PointFigureChart RectangleChart RenkoChart SectorChart TradingChart BarChart3D BubbleChart3D PieChart3D RectangleChart3D SectorChart3D DensityHistogram Histogram ImageHistogram PairedHistogram PairedSmoothHistogram SmoothDensityHistogram SmoothHistogram Histogram3D SmoothHistogram3D
TimeSeries EventSeries Quantity Association WeightedData ArrayPlot BodePlot ChromaticityPlot CommunityGraphPlot ContourPlot DateListLogPlot DateListPlot DensityPlot DiscretePlot GeoListPlot GeoRegionValuePlot GraphPlot JuliaSetPlot LayeredGraphPlot LineIntegralConvolutionPlot ListContourPlot ListCurvePathPlot ListDensityPlot ListLineIntegralConvolutionPlot ListLinePlot ListLogLinearPlot ListLogLogPlot ListLogPlot ListPlot ListPolarPlot ListStreamDensityPlot ListStreamPlot ListVectorDensityPlot ListVectorPlot LogLinearPlot LogLogPlot LogPlot MandelbrotSetPlot MatrixPlot NicholsPlot NumberLinePlot NyquistPlot ParametricPlot Plot PolarPlot ProbabilityPlot ProbabilityScalePlot QuantilePlot RegionPlot ReliefPlot RootLocusPlot SingularValuePlot StreamDensityPlot StreamPlot TreePlot VectorDensityPlot VectorPlot WaveletImagePlot WaveletListPlot WaveletMatrixPlot ChromaticityPlot3D ContourPlot3D DiscretePlot3D GraphPlot3D ListContourPlot3D ListPlot3D ListPointPlot3D ListSurfacePlot3D ListVectorPlot3D ParametricPlot3D Plot3D RegionPlot3D RevolutionPlot3D SphericalPlot3D VectorPlot3D BarChart BoxWhiskerChart BubbleChart CandlestickChart DistributionChart InteractiveTradingChart KagiChart LineBreakChart PairedBarChart PieChart PointFigureChart RectangleChart RenkoChart SectorChart TradingChart BarChart3D BubbleChart3D PieChart3D RectangleChart3D SectorChart3D DensityHistogram Histogram ImageHistogram PairedHistogram PairedSmoothHistogram SmoothDensityHistogram SmoothHistogram Histogram3D SmoothHistogram3D


