This page requires that JavaScript be enabled in your browser.
Learn how »
Creating Rich Visualizations to Explore Your Data
Brett Champion
Harness the power of Mathematica to interactively visualize your data. This Wolfram Mathematica Virtual Conference 2011 course features a series of examples that show how to create a rich interface for exploring data in depth.
Thanks for your feedback.
Channels: Virtual Events
701 videos match your search.
 |
ウルフラム リサーチ アジア リミティッドのリージョナル オフィス マネージャー,中村英史がWolframバーチャルコンファレンスJapan 2015にご参加の皆様への開会のご挨拶を申し上げ,本日のプログラムについてかいつまんでご紹介いたします. |
 |
同志社大学 生命医科学部 教授 伊藤利明 |
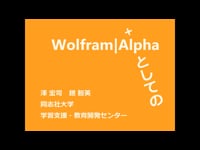 |
同志社大学 学習支援・教育開発センター 澤宏司・趙智英 |
 |
|
 |
|
 |
|
 |
|
 |
|
 |
|
 |
|
 |
|
 |
|
 |
|
 |
|
 |
|
 |
|
 |
|
 |
|
 |
|
 |
|
