This page requires that JavaScript be enabled in your browser.
Learn how »
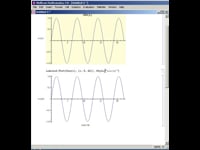
How to Make a Legend for My Plots
Nick Gaskill
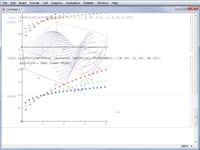
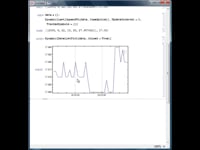
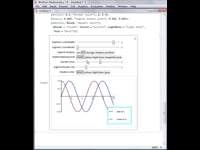
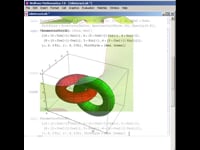
Mathematica provides many options for customizing and annotating plots. Legends can be added to plots and customized with many of the same methods used to customize other Mathematica graphics. Learn more in this "How to" screencast.
Thanks for your feedback.
Channels: Function-Visualization-Videos
5 videos match your search.
 |
Nick Gaskill In addition to letting you change the size of points in a 2D plot, Mathematica also lets you change the color and type of marker for points. Learn how in ... |
 |
Faisal Whelpley Mathematica can collect, process, and display data dynamically and in real time. A large collection of curated data is built into Mathematica, which puts an extraordinary amount of information at ... |
 |
Nick Gaskill Mathematica provides many options for customizing and annotating plots. Legends can be added to plots and customized with many of the same methods used to customize other Mathematica graphics. Learn ... |
 |
Chris Hill One of the most powerful aspects of graphics in Mathematica is their interactivity. Rotating, zooming, and panning your graphics allows for a more complete visualization experience by letting you understand ... |
 |
Chris Carlson Mathematica provides flexible options for labeling plots, allowing you to present ideas more clearly in presentations and publications. Learn more in this "How to" screencast. |
