This page requires that JavaScript be enabled in your browser.
Learn how »
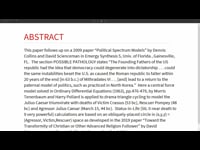
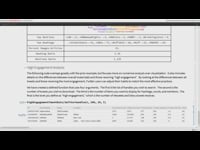
Mathematica Graphics for Presenting Multidimensional Evidence
Robert Yerex
Robert Yerex, chief economist at Kronos and creator of the Retail Labor Index, explained how he uses Mathematica to develop effective multidimensional infographics about trends in employment and retail sales at the Wolfram Technology Conference 2010.
Thanks for your feedback.
Channels: Technology Conference
1311 videos match your search.
 |
Jay Weininger |
 |
Dennis Collins |
 |
Maureen Baehr, Benji Bernstein &
Ben Kickert |
 |
Галина Михалкина, Григорий Фридман |
 |
Тигран Ишханян |
 |
Микаэл Эгибян |
 |
Ankit Naik |
 |
Микаэл Эгибян |
 |
Галина Михалкина |
 |
Антон Екименко, Кирилл Белов |
 |
Роман Аверьянов |
 |
Алексей Семенов |
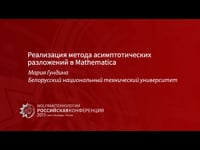 |
Мария Гундина |
 |
Николай Сосновский |
 |
Николай Вавилов |
 |
Александр Ганьшин |
 |
Виктория Карабанова, Илья Марчевский |
 |
Олег Кофнов |
 |
Галина Михалкина |
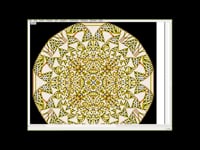 |
Roman Maeder A look at the fascinating toppling sequences that arise from various initial conditions, leading to fractal images, and discuss efficient code for generating animations and images with millions of grains ... |
