This page requires that JavaScript be enabled in your browser.
Learn how »
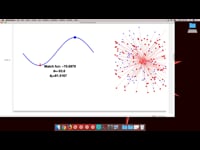
Mathematica Graphics for Presenting Multidimensional Evidence
Robert Yerex
Robert Yerex, chief economist at Kronos and creator of the Retail Labor Index, explained how he uses Mathematica to develop effective multidimensional infographics about trends in employment and retail sales at the Wolfram Technology Conference 2010.
Thanks for your feedback.
Channels: Technology Conference
1311 videos match your search.
 |
Oliver Ruebenkoenig |
 |
Rohit Panse |
 |
Seth Chandler |
 |
Suba Thomas This talk demonstrates how the Microcontroller Kit can be used to deploy code to a robot. Control systems functionality is used to design a differential speed controller, which, along with the Arduino libraries for the relevant sensors and actuators, is deployed to ... |
 |
Tom Sherlock |
 |
Tom Wickham-Jones |
 |
Tuseeta Banerjee |
 |
Tuseeta Banerjee & Matteo Salvarezza |
 |
Yash Akhauri |
 |
José Luis Gómez-Muñoz |
 |
Rob Knapp |
 |
Neil Singer |
 |
Alec Shedelbower |
 |
Andrea Griffin & Kyle Keane |
 |
Andrew Hanson |
 |
Ankit Naik |
 |
Ariel Sepulveda |
 |
Atsushi Miyazawa |
 |
Brett Champion |
 |
Carlo Giacometti |
