This page requires that JavaScript be enabled in your browser.
Learn how »
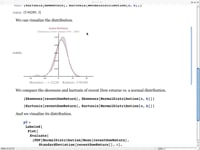
Visualization: Histograms and Density Estimates
Brett Champion
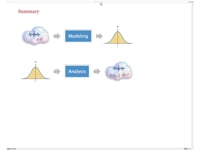
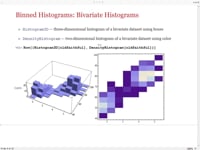
This Wolfram Training on-demand course provides an overview of some of the new statistical visualization functionality in Mathematica 8. Topics include visual inspection of the shape of data and comparisons to distributions and datasets. Binned and smooth histograms are covered.
Thanks for your feedback.
Channels: Statistical-Visualization-Training-Courses
4 videos match your search.
 |
Samuel Chen Statistical methods provide a powerful tool for analyzing and drawing conclusions from financial data. This Wolfram Training on-demand screencast showcases the application of probability, distribution, and statistical analysis to financial ... |
 |
Roger Germundsson Get an overview of Mathematica's new high-level functions for probability and statistics and learn how to work with its large collection of built-in distributions in this Wolfram Training course. |
 |
Brett Champion This Wolfram Training on-demand course provides an overview of some of the new statistical visualization functionality in Mathematica 8. Topics include visual inspection of the shape of data and comparisons to ... |
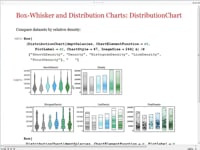 |
Brett Champion This Wolfram Training course provides an overview of some of the new statistical visualization functionality in Mathematica 8. Quantile plots, box-and-whisker plots, probability plots, and distribution charts are covered. |
