This page requires that JavaScript be enabled in your browser.
Learn how »
Finance: Financial Statistics
Samuel Chen
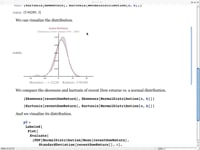
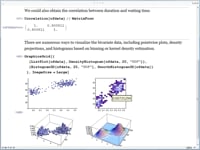
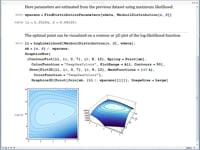
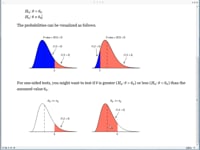
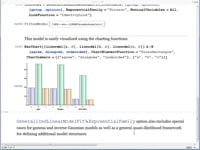
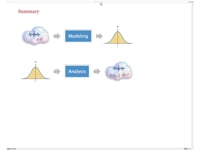
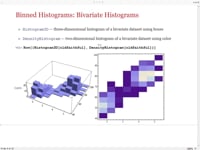
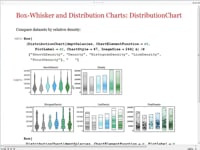
Statistical methods provide a powerful tool for analyzing and drawing conclusions from financial data. This Wolfram Training on-demand screencast showcases the application of probability, distribution, and statistical analysis to financial data.
Thanks for your feedback.
Channels: Statistics-Training-Courses
8 videos match your search.
 |
Samuel Chen Statistical methods provide a powerful tool for analyzing and drawing conclusions from financial data. This Wolfram Training on-demand screencast showcases the application of probability, distribution, and statistical analysis to financial ... |
 |
Darren Glosemeyer Mathematica provides numerous functions for describing and visualizing properties of data. This Wolfram Training course covers shape statistics, measures for multivariate data, charts, and plots. |
 |
Darren Glosemeyer This Wolfram Training on-demand course gives a comprehensive look at statistical distributions in Mathematica, including functions for constructing or deriving new distributions, automated estimation of distribution parameters, and goodness-of-fit testing ... |
 |
Darren Glosemeyer Mathematica's framework for hypothesis testing includes parametric and nonparametric tests of location, variance, or scale. Additional topics covered in this Wolfram Training on-demand course include functions for common named tests, ... |
 |
Darren Glosemeyer Model fitting and analysis topics covered in this Wolfram Training on-demand course include Mathematica's framework and functionality for linear and nonlinear regression; logit, probit, and other generalized linear models; and ... |
 |
Roger Germundsson Get an overview of Mathematica's new high-level functions for probability and statistics and learn how to work with its large collection of built-in distributions in this Wolfram Training course. |
 |
Brett Champion This Wolfram Training on-demand course provides an overview of some of the new statistical visualization functionality in Mathematica 8. Topics include visual inspection of the shape of data and comparisons to ... |
 |
Brett Champion This Wolfram Training course provides an overview of some of the new statistical visualization functionality in Mathematica 8. Quantile plots, box-and-whisker plots, probability plots, and distribution charts are covered. |
