This page requires that JavaScript be enabled in your browser.
Learn how »
Geographic Computation & Visualization
Bjorn Zimmermann
In this presentation, Bjorn Zimmermann, Wolfram|Alpha scientific content manager, shows maps and the geographic data and entities available in the Wolfram Language and Mathematica 10.
Thanks for your feedback.
Channels: Wolfram Experts Live
82 videos match your search.
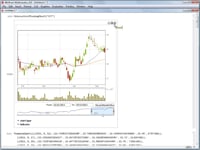 |
Brett Champion This video from Mathematica Experts Live: Visualization Q&A 2012 explores the features of Mathematica's interactive trading charts, including how to customize the financial visualization tool for your own use. |
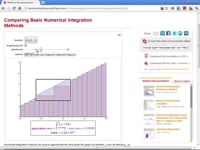 |
Vitaliy Kaurov The Wolfram Demonstrations Project is a great resource for exploring graphics ideas as demonstrated in this video, which answers a question submitted by an educator during Mathematica Experts Live: Visualization ... |
