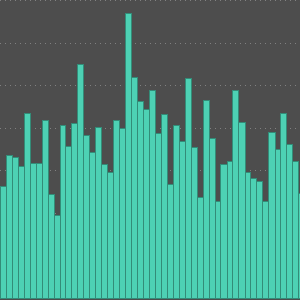
음성 시각화
음성 신호의 파형을 시각화합니다.
In[1]:=
rule30 = Import["ExampleData/rule30.wav"]Out[1]=
In[2]:=
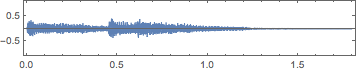
AudioPlot[rule30, ImageSize -> Medium]Out[2]=
파형의 절대값을 플롯합니다.
In[3]:=
AudioPlot[rule30, Appearance -> "ContinuousAbs", ImageSize -> Medium,
 PlotRange -> All]
Out[3]=
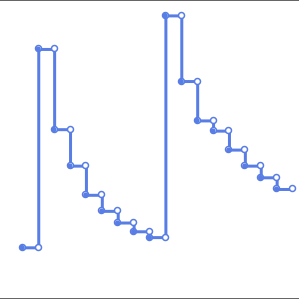
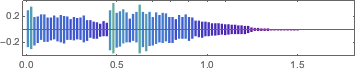
파형을 이산 값으로 플롯하고 높이에 따라 채색합니다.
In[4]:=
AudioPlot[rule30, Appearance -> "Discrete", ImageSize -> Medium,
 ColorFunction -> Function[{x, y}, ColorData["Rainbow", y]],
 PlotRange -> All]
Out[4]=
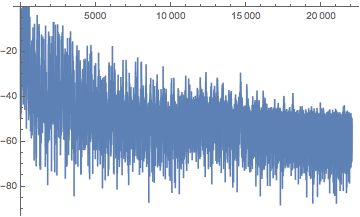
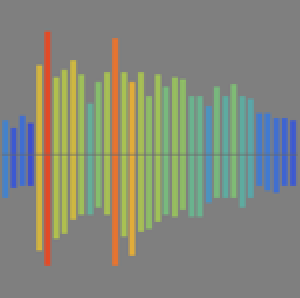
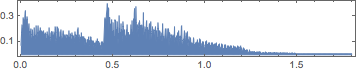
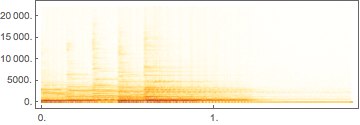
음성 신호의 스펙트럼과 피리어드그램을 플롯합니다.
In[5]:=
Spectrogram[rule30, ImageSize -> Medium]Out[5]=
In[6]:=
Periodogram[rule30, ImageSize -> Medium]Out[6]=