数量を含む切断分布
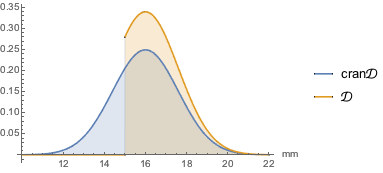
アメリカのクランベリーの直径は,平均16mm,標準偏差1.6mmの正規分布に従う.果実は,直径が少なくとも15mmなければ,丸ごとの形で売ることはできない.それ以外のサイズのものはクランベリーソースの生産に使われる.丸ごとの形で売られる果実のサイズの分布を求める.
In[1]:=
cran\[ScriptCapitalD] =
  NormalDistribution[Quantity[16, "Millimeters"],
   Quantity[1.6, "Millimeters"]];
\[ScriptCapitalD] =
  TruncatedDistribution[{Quantity[15, "Millimeters"], \[Infinity]},
   cran\[ScriptCapitalD]];
確率密度関数を比べる.
In[2]:=

Plot[{PDF[cran\[ScriptCapitalD], Quantity[x, "Milimeters"]],
  PDF[\[ScriptCapitalD], Quantity[x, "Milimeters"]]}, {x, 10, 22},
 PlotLegends -> {"cran\[ScriptCapitalD]", "\[ScriptCapitalD]"},
 Filling -> Axis, AxesLabel -> {"mm"}]
Out[2]=

1ポンドパッケージのクランベリーは,容量がおよそ30立方インチであるとして,そのようなパッケージに入っているクランベリーの数の上限と下限それぞれの平均を求める.
In[3]:=

lowerbound =
 Floor[NExpectation[
   Divide[Quantity[30, "Inches"^3],
    Volume[Cuboid[{0, 0, 0}, {x, x, x}]]],
   x \[Distributed] \[ScriptCapitalD]]]
Out[3]=
In[4]:=

upperbound =
 Ceiling[NExpectation[
   Divide[Quantity[30, "Inches"^3], Volume[Ball[{0, 0, 0}, x/2]]],
   x \[Distributed] \[ScriptCapitalD]]]
Out[4]=


