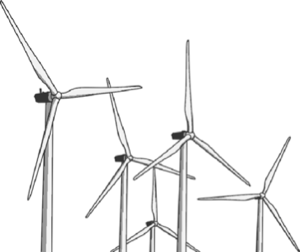
トンネル
TunnelDataは,長さや所在地等,トンネルについての情報を提供する.
In[1]:=
tunnels = TunnelData[];In[2]:=
Length[tunnels]Out[2]=
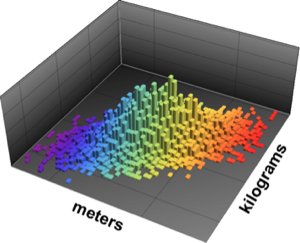
それぞれのトンネルについて,単一あるいは複数の国で与えられる長さと所在地を求める.
In[3]:=
rawData = TunnelData[tunnels, {"Countries", "Length"}];データをきれいにし,欠測値を取り除く.
In[4]:=
data = DeleteMissing[rawData, 1, 2];長さのデータをマイルに変換する.
In[5]:=
data[[All, 2]] = UnitConvert[N[data[[All, 2]]], "Miles"];In[6]:=
lengths = data[[All, 2]];In[7]:=
MinMax[lengths]Out[7]=
In[8]:=
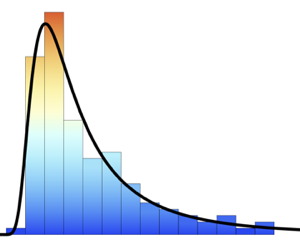
h = Histogram[lengths, {1, 12, .5}, PDF, FrameLabel -> Automatic,
  PlotTheme -> "Detailed"]
Out[8]=
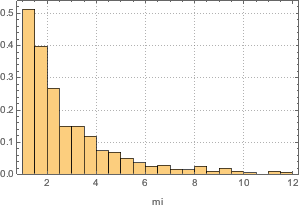
データは長い裾を持つ分布の混合で説明できることがある.
In[9]:=
dist = MixtureDistribution[{w1,
    w2}, {ParetoDistribution[a1, a2, a3, a4],
    WeibullDistribution[b1, b2]}];
In[10]:=
edist = EstimatedDistribution[lengths, dist]Out[10]=
パラメトリック族の混合分布に対する適合度を検定する.
In[11]:=
DistributionFitTest[lengths, dist, "TestDataTable"]Out[11]=
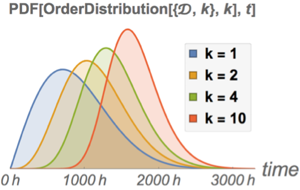
フィットされた分布の確率密度関数をヒストグラムに対してプロットする.
In[12]:=
Show[h, Plot[PDF[edist, Quantity[x, "Miles"]], {x, 1, 12},
   PlotRange -> All] // Quiet]
Out[12]=

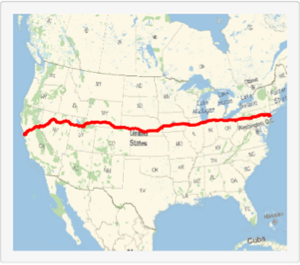
トンネルの所在地を可視化する.
国ごとにグループ分けする.
In[13]:=
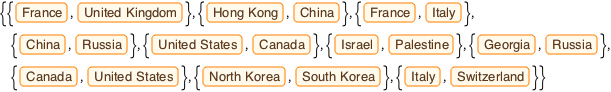
res = GroupBy[data, First, Flatten[Take[#, All, -1]] &];トンネルの中には複数の国にまたがっているものもある.
In[14]:=
shared = Select[Keys[res], Length[#] > 1 &]Out[14]=
共有されているトンネルを分配し,少なくとも10本のトンネルがある国を選ぶ.長さの分布図をプロットする.
完全なWolfram言語入力を表示する
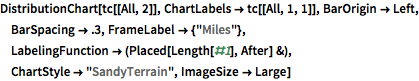
Out[18]=
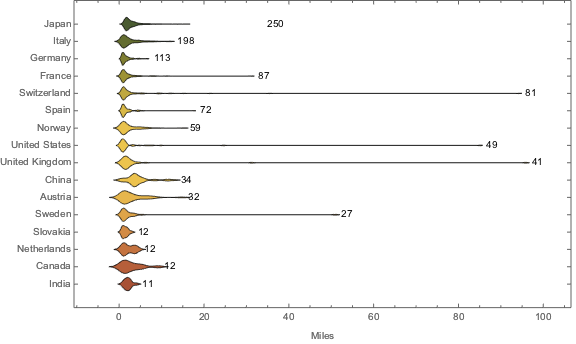
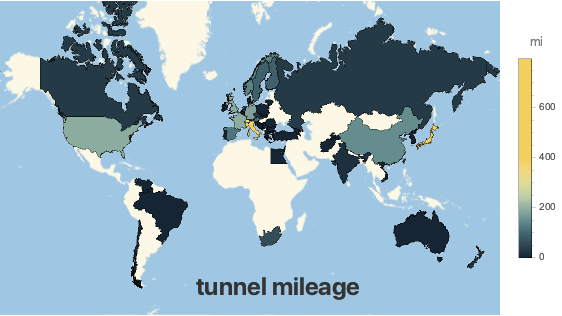
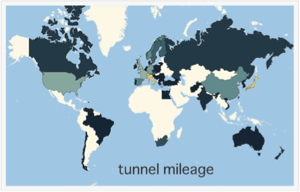
国ごとのトンネルの総マイル数.共有されるトンネルについては各国における完全な長さを含む.
完全なWolfram言語入力を表示する
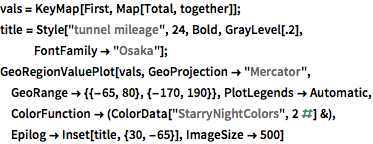
Out[19]=