Wolfram 语言

概率和统计中的量

隧道

TunnelData 提供关于隧道的信息,比如它们的长度和位置.

In[1]:=
Click for copyable input
tunnels = TunnelData[];
In[2]:=
Click for copyable input
Length[tunnels]
Out[2]=

给出每个隧道的长度和所处国家的信息.

In[3]:=
Click for copyable input
rawData = TunnelData[tunnels, {"Countries", "Length"}];

整理数据,清除缺失的值.

In[4]:=
Click for copyable input
data = DeleteMissing[rawData, 1, 2];

将长度的单位转换成英里.

In[5]:=
Click for copyable input
data[[All, 2]] = UnitConvert[N[data[[All, 2]]], "Miles"];
In[6]:=
Click for copyable input
lengths = data[[All, 2]];
In[7]:=
Click for copyable input
MinMax[lengths]
Out[7]=
In[8]:=
Click for copyable input
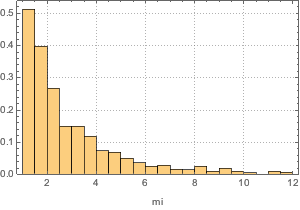
h = Histogram[lengths, {1, 12, .5}, PDF, FrameLabel -> Automatic, PlotTheme -> "Detailed"]
Out[8]=

可以用混合长尾分布来描述数据.

In[9]:=
Click for copyable input
dist = MixtureDistribution[{w1, w2}, {ParetoDistribution[a1, a2, a3, a4], WeibullDistribution[b1, b2]}];
In[10]:=
Click for copyable input
edist = EstimatedDistribution[lengths, dist]
Out[10]=

与参数族混合分布相比较,检验拟合优度.

In[11]:=
Click for copyable input
DistributionFitTest[lengths, dist, "TestDataTable"]
Out[11]=

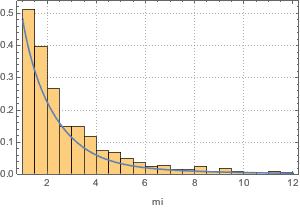
同时绘制拟合分布的 PDF 与直方图.

In[12]:=
Click for copyable input
Show[h, Plot[PDF[edist, Quantity[x, "Miles"]], {x, 1, 12}, PlotRange -> All] // Quiet]
Out[12]=

可视化隧道的位置.

按国家分组.

In[13]:=
Click for copyable input
res = GroupBy[data, First, Flatten[Take[#, All, -1]] &];

有些隧道跨越不止一个国家.

In[14]:=
Click for copyable input
shared = Select[Keys[res], Length[#] > 1 &]
Out[14]=

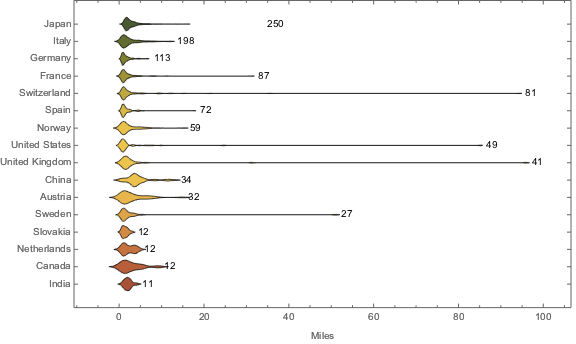
分配共享隧道,选择至少有 10 个隧道的国家. 绘制长度分布图.

显示完整的 Wolfram 语言输入
In[15]:=
Click for copyable input
split = GroupBy[ Flatten[Map[{{{#[[1]]}, res[#]}, {{#[[2]]}, res[#]}} &, shared], 1], First, Flatten[#[[All, 2]]] &];
In[16]:=
Click for copyable input
together = Join[KeyDrop[res, shared], split, 2];
In[17]:=
Click for copyable input
tc = SortBy[Select[Normal[together], Length[#[[2]]] >= 10 &], Length@*Last];
In[18]:=
Click for copyable input
DistributionChart[tc[[All, 2]], ChartLabels -> tc[[All, 1, 1]], BarOrigin -> Left, BarSpacing -> .3, FrameLabel -> {"Miles"}, LabelingFunction -> (Placed[Length[#1], After] &), ChartStyle -> "SandyTerrain", ImageSize -> Large]
Out[18]=

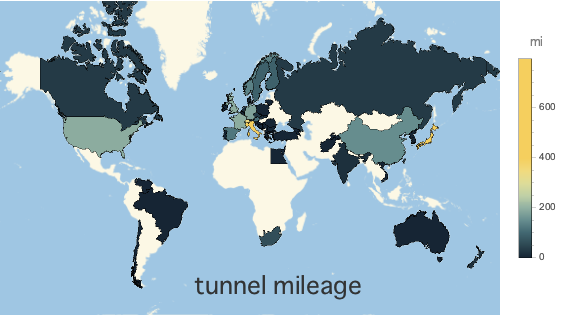
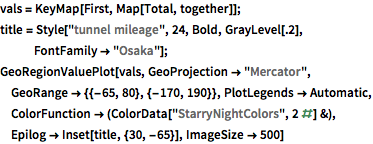
每个国家拥有的隧道的总英里数,包括共享隧道的全长.

显示完整的 Wolfram 语言输入
In[19]:=
Click for copyable input
vals = KeyMap[First, Map[Total, together]]; title = Style["tunnel mileage", 24, Bold, GrayLevel[.2], FontFamily -> "Osaka"]; GeoRegionValuePlot[vals, GeoProjection -> "Mercator", GeoRange -> {{-65, 80}, {-170, 190}}, PlotLegends -> Automatic, ColorFunction -> (ColorData["StarryNightColors", 2 #] &), Epilog -> Inset[title, {30, -65}], ImageSize -> 500]
Out[19]=

相关范例

de en es fr ja ko pt-br ru