天気予報
Wolfram Knowledgebaseには,静的な知識やリアルタイムのデータだけでなく,天候に関連する事象等の未来の事象の予測も含まれている.この例では,WeatherForecastDataを使って予報を取り出し,AirTemperatureDataに含まれる過去の値と比較し,結果をさまざまに可視化する.
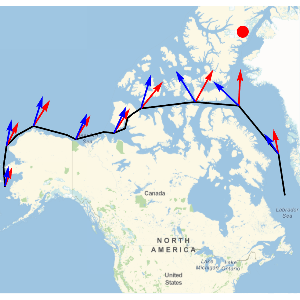
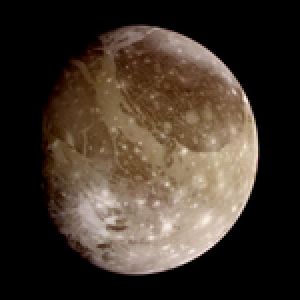
自由形式入力で指定された,グリーンランドの首都の今週の平均気温の予報を返す.
In[1]:=
forecast = WeatherForecastData[\!\(\*
NamespaceBox["LinguisticAssistant",
DynamicModuleBox[{Typeset`query$$ = "greenland capital",
      Typeset`boxes$$ = RowBox[{
TemplateBox[{"\"Greenland\"",
RowBox[{"Entity", "[",
RowBox[{"\"Country\"", ",", "\"Greenland\""}], "]"}],
          "\"Entity[\\\"Country\\\", \\\"Greenland\\\"]\"",
          "\"country\""}, "Entity"], "[",
TemplateBox[{"\"capital city\"",
RowBox[{"EntityProperty", "[",
RowBox[{"\"Country\"", ",", "\"CapitalCity\""}], "]"}],
          "\"EntityProperty[\\\"Country\\\", \\\"CapitalCity\\\"]\""},
          "EntityProperty"], "]"}], Typeset`allassumptions$$ = {},
      Typeset`assumptions$$ = {}, Typeset`open$$ = {1},
      Typeset`querystate$$ = {
      "Online" -> True, "Allowed" -> True,
       "mparse.jsp" -> 0.449168`6.10395380181902, "Messages" -> {}}},

DynamicBox[ToBoxes[
AlphaIntegration`LinguisticAssistantBoxes["", 4, Automatic,
Dynamic[Typeset`query$$],
Dynamic[Typeset`boxes$$],
Dynamic[Typeset`allassumptions$$],
Dynamic[Typeset`assumptions$$],
Dynamic[Typeset`open$$],
Dynamic[Typeset`querystate$$]], StandardForm],
ImageSizeCache->{121., {7., 16.}},
TrackedSymbols:>{
        Typeset`query$$, Typeset`boxes$$, Typeset`allassumptions$$,
         Typeset`assumptions$$, Typeset`open$$, Typeset`querystate$$}],
DynamicModuleValues:>{},
UndoTrackedVariables:>{Typeset`open$$}],
BaseStyle->{"Deploy"},
DeleteWithContents->True,
Editable->False,
SelectWithContents->True]\), "Temperature"]
Out[1]=
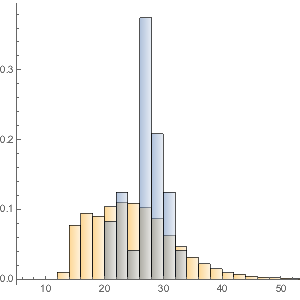
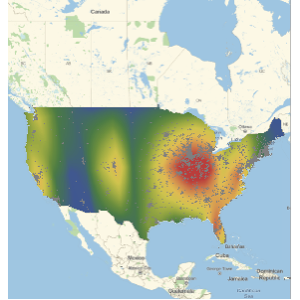
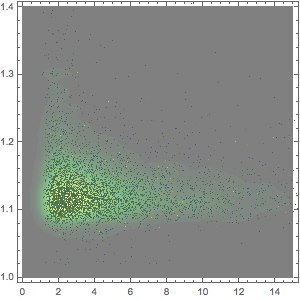
過去10年間の週ごとの平均気温を取り出し,その前10年間の平均気温と比較する.
完全なWolfram言語入力を表示する
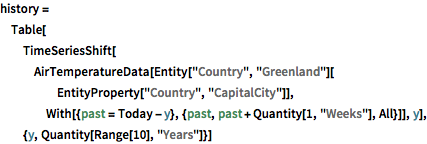
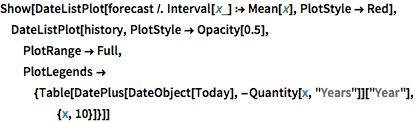
Out[3]=

異なる2つの都市を取り巻く地域の気温範囲の違いを調べ,比較する.
In[4]:=

Table[WeatherForecastData[
  GeoDisk[city[EntityProperty["City", "Position"]],
   Quantity[100, "Miles"]], "Temperature",
  DateObject[
   Tomorrow, {12}]], {city, {Entity[
    "City", {"Champaign", "Illinois", "UnitedStates"}],
   Entity["City", {"SanFrancisco", "California", "UnitedStates"}]}}]
Out[4]=
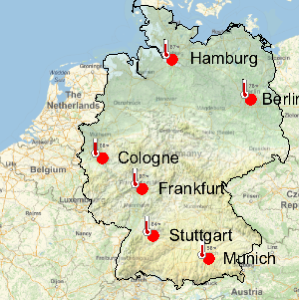
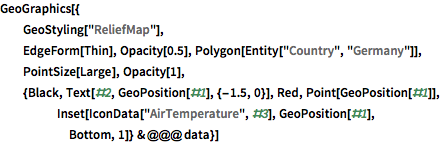
ドイツの6大都市をリストにし,各都市の今日の最高気温の予測を取得する.
In[5]:=

cities = EntityClass[
   "City", {"Country" -> "Germany", "Population" -> TakeLargest[6]}] //
   EntityList
Out[5]=
In[6]:=

data = {CityData[#, "Coordinates"], CityData[#, "Name"],
WeatherForecastData[#, "MaxTemperature"]["FirstValue"]} & /@
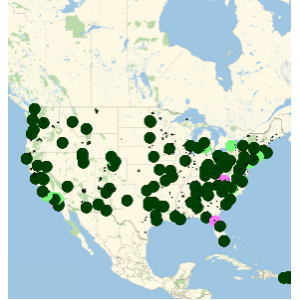
cities;地図上に可視化する.
完全なWolfram言語入力を表示する
Out[7]=