Faça a previsão do tempo
A Wolfram Knowledgebase contém não só dados de conhecimento estático e em tempo real, mas também previsões de eventos futuros, tais como aqueles associados ao clima. Este exemplo extrai previsão usando WeatherForecastData, compara-os com os valores históricos conhecidos de AirTemperatureData, e fornece um número de visualizações dos resultados.
Saiba as temperaturas médias previstas para esta semana para a capital da Groenlândia, especificadas usando inputs de forma livre.
forecast = WeatherForecastData[\!\(\*
NamespaceBox["LinguisticAssistant",
DynamicModuleBox[{Typeset`query$$ = "greenland capital",
      Typeset`boxes$$ = RowBox[{
TemplateBox[{"\"Greenland\"",
RowBox[{"Entity", "[",
RowBox[{"\"Country\"", ",", "\"Greenland\""}], "]"}],
          "\"Entity[\\\"Country\\\", \\\"Greenland\\\"]\"",
          "\"country\""}, "Entity"], "[",
TemplateBox[{"\"capital city\"",
RowBox[{"EntityProperty", "[",
RowBox[{"\"Country\"", ",", "\"CapitalCity\""}], "]"}],
          "\"EntityProperty[\\\"Country\\\", \\\"CapitalCity\\\"]\""},
          "EntityProperty"], "]"}], Typeset`allassumptions$$ = {},
      Typeset`assumptions$$ = {}, Typeset`open$$ = {1},
      Typeset`querystate$$ = {
      "Online" -> True, "Allowed" -> True,
       "mparse.jsp" -> 0.449168`6.10395380181902, "Messages" -> {}}},

DynamicBox[ToBoxes[
AlphaIntegration`LinguisticAssistantBoxes["", 4, Automatic,
Dynamic[Typeset`query$$],
Dynamic[Typeset`boxes$$],
Dynamic[Typeset`allassumptions$$],
Dynamic[Typeset`assumptions$$],
Dynamic[Typeset`open$$],
Dynamic[Typeset`querystate$$]], StandardForm],
ImageSizeCache->{121., {7., 16.}},
TrackedSymbols:>{
        Typeset`query$$, Typeset`boxes$$, Typeset`allassumptions$$,
         Typeset`assumptions$$, Typeset`open$$, Typeset`querystate$$}],
DynamicModuleValues:>{},
UndoTrackedVariables:>{Typeset`open$$}],
BaseStyle->{"Deploy"},
DeleteWithContents->True,
Editable->False,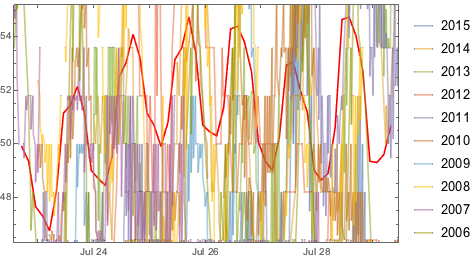
SelectWithContents->True]\), "Temperature"]Extraia as temperaturas médias semanais durante a última década e compare com as temperaturas dos 10 anos anteriores.
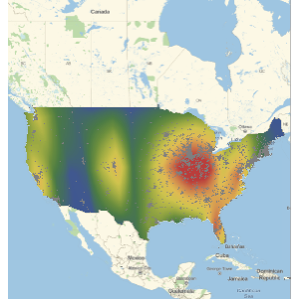
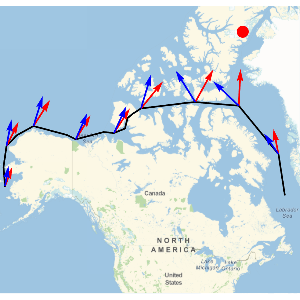
Examine e contraste a diferença de variações de temperatura entre as regiões em volta de duas cidades diferentes.
Table[WeatherForecastData[
GeoDisk[city[EntityProperty["City", "Position"]],
Quantity[100, "Miles"]], "Temperature",
DateObject[
Tomorrow, {12}]], {city, {Entity[
"City", {"Champaign", "Illinois", "UnitedStates"}],
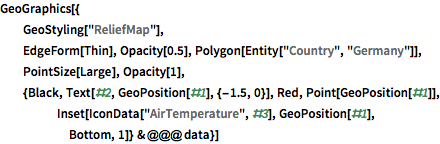
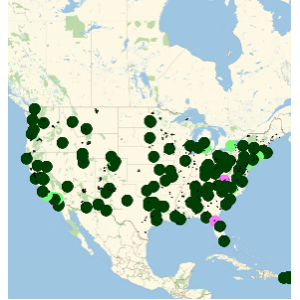
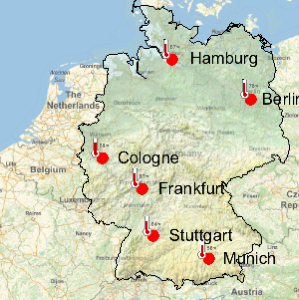
Entity["City", {"SanFrancisco", "California", "UnitedStates"}]}}]Liste as seis maiores cidades da Alemanha e obtenha a previsão das altas temperaturas para essas cidades.
cities = EntityClass[
   "City", {"Country" -> "Germany", "Population" -> TakeLargest[6]}] //
   EntityList
data = {CityData[#, "Coordinates"], CityData[#, "Name"],
     WeatherForecastData[#, "MaxTemperature"]["FirstValue"]} & /@
   cities;
Visualize em um mapa.