气象预测
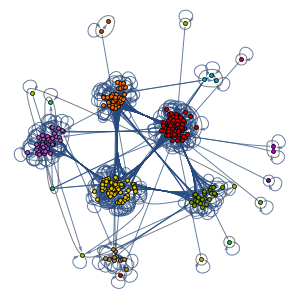
Wolfram Knowledgebase 不仅包含了静态知识和实时数据,还可以对诸如与气候相关的未来事件进行预测. 该范例使用 WeatherForecastData 提取预测,将其与 AirTemperatureData 中已知的历史数值进行比较,并提供多个可视化结果.
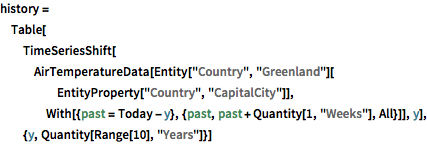
用自然语言输入指定格陵兰首都,给出本周的平均温度预测.
In[1]:=
forecast = WeatherForecastData[\!\(\*
NamespaceBox["LinguisticAssistant",
DynamicModuleBox[{Typeset`query$$ = "greenland capital",
      Typeset`boxes$$ = RowBox[{
TemplateBox[{"\"Greenland\"",
RowBox[{"Entity", "[",
RowBox[{"\"Country\"", ",", "\"Greenland\""}], "]"}],
          "\"Entity[\\\"Country\\\", \\\"Greenland\\\"]\"",
          "\"country\""}, "Entity"], "[",
TemplateBox[{"\"capital city\"",
RowBox[{"EntityProperty", "[",
RowBox[{"\"Country\"", ",", "\"CapitalCity\""}], "]"}],
          "\"EntityProperty[\\\"Country\\\", \\\"CapitalCity\\\"]\""},
          "EntityProperty"], "]"}], Typeset`allassumptions$$ = {},
      Typeset`assumptions$$ = {}, Typeset`open$$ = {1},
      Typeset`querystate$$ = {
      "Online" -> True, "Allowed" -> True,
       "mparse.jsp" -> 0.449168`6.10395380181902, "Messages" -> {}}},

DynamicBox[ToBoxes[
AlphaIntegration`LinguisticAssistantBoxes["", 4, Automatic,
Dynamic[Typeset`query$$],
Dynamic[Typeset`boxes$$],
Dynamic[Typeset`allassumptions$$],
Dynamic[Typeset`assumptions$$],
Dynamic[Typeset`open$$],
Dynamic[Typeset`querystate$$]], StandardForm],
ImageSizeCache->{121., {7., 16.}},
TrackedSymbols:>{
        Typeset`query$$, Typeset`boxes$$, Typeset`allassumptions$$,
         Typeset`assumptions$$, Typeset`open$$, Typeset`querystate$$}],
DynamicModuleValues:>{},
UndoTrackedVariables:>{Typeset`open$$}],
BaseStyle->{"Deploy"},
DeleteWithContents->True,
Editable->False,
SelectWithContents->True]\), "Temperature"]
Out[1]=
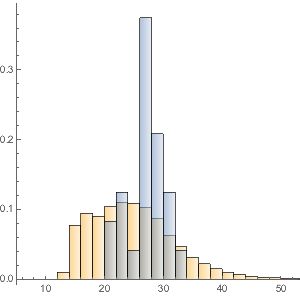
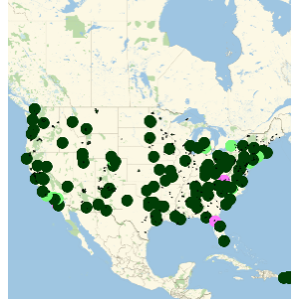
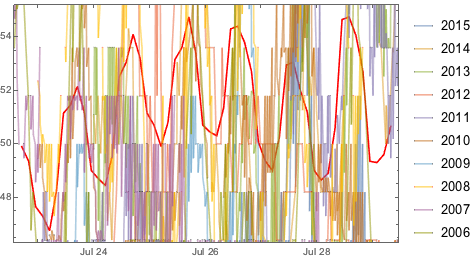
提取过去 10 年的周平均温度,并与前 10 年进行比较
显示完整的 Wolfram 语言输入
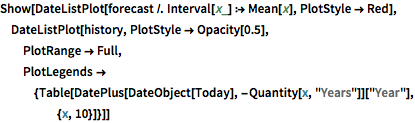
Out[3]=
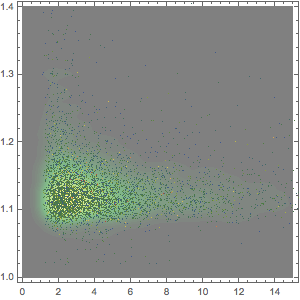
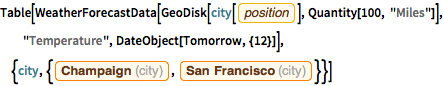
调查并测试两个不同城市周边的地区的温度范围差别.
In[4]:=
Table[WeatherForecastData[
  GeoDisk[city[EntityProperty["City", "Position"]],
   Quantity[100, "Miles"]], "Temperature",
  DateObject[
   Tomorrow, {12}]], {city, {Entity[
    "City", {"Champaign", "Illinois", "UnitedStates"}],
   Entity["City", {"SanFrancisco", "California", "UnitedStates"}]}}]
Out[4]=
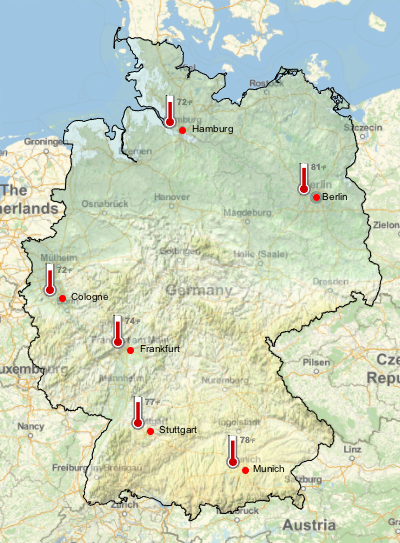
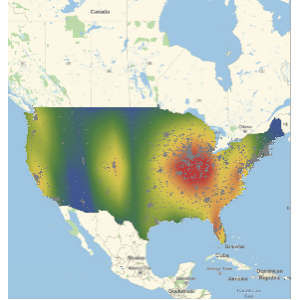
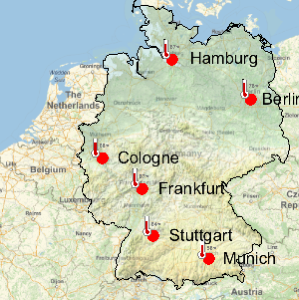
列出德国最大的 6 个城市并获取今天的最高温度预测.
In[5]:=
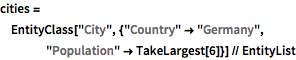
cities = EntityClass[
   "City", {"Country" -> "Germany", "Population" -> TakeLargest[6]}] //
   EntityList
Out[5]=
In[6]:=
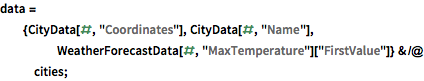
data = {CityData[#, "Coordinates"], CityData[#, "Name"],
WeatherForecastData[#, "MaxTemperature"]["FirstValue"]} & /@
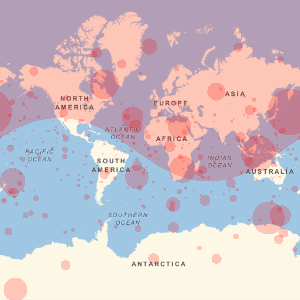
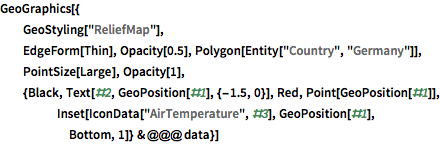
cities;在地图上可视化.
显示完整的 Wolfram 语言输入
Out[7]=