Pokémon Power
The Wolfram Knowledgebase contains information on popular culture icons as well as scientific knowledge. Here, various physical characteristics (attack and defense points, weight, color) of the Pokémon menagerie are explored, contrasted, and visualized using the built-in entity framework.
Plot the distributions of attack and defense points in all Pokémon.

PairedHistogram[EntityValue["Pokemon", "Attack"],
 EntityValue["Pokemon", "Defense"],
 ChartLabels -> {"attack", "defense"},
 ChartStyle -> {{LightOrange, LightBlue}, None}]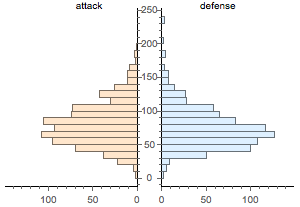
Create a Dataset of attack vs. defense points for Generation VI Pokémon and plot them against each other.

stat = EntityValue[Entity[
   "Pokemon", {
    "Generation" -> Entity[
      "PokemonGeneration", "GenerationVI"]}], {"Attack", "Defense"},
"Dataset"];ListPlot[stat,
PlotStyle -> Directive[Opacity[0.5], Orange, PointSize[Medium]],
AxesLabel -> Automatic, LabelingFunction -> None]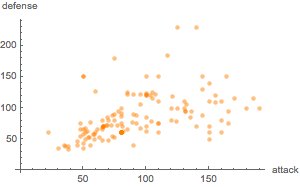
Compare and plot the average weights of Pokémon over different generations.

wg = Normal[
  GroupBy[Rule @@@ EntityValue["Pokemon", {"Generation", "Weight"}],
   First -> Last, Mean]]
BarChart3D[wg[[All, 2]], ChartLegends -> wg[[All, 1]],
 ChartStyle -> 24]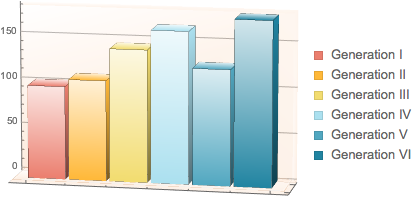
Use an implicitly defined entity class to find the three heaviest Pokémon.
EntityList[EntityClass["Pokemon", {"Weight" -> TakeLargest[3]}]]EntityList[EntityClass["Pokemon", {"Weight" -> TakeLargest[3]}]];
EntityValue[%, "Generation"]Use an implicitly defined entity class to find the yellow Pokémon weighing between 50 and 100 kg.

yellowMidweights = EntityList[
Entity["Pokemon", {"PokedexColor" -> "Yellow", "Weight" -> Between[{
Quantity[50, "Kilograms"],
Quantity[100, "Kilograms"]}]}]]
Create a collage of these Pokémon characters with sizes based on their weights.
ImageCollage[
 Rule @@@ EntityValue[yellowMidweights, {"Weight", "Image"}],
 Background -> White]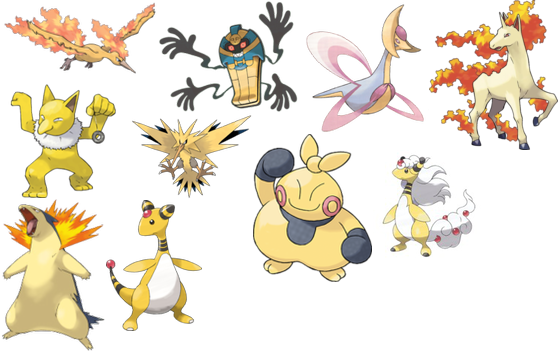
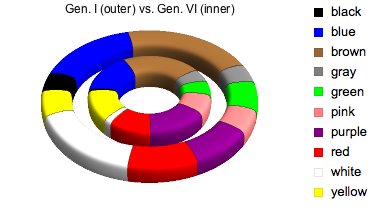
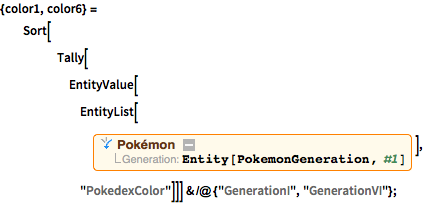
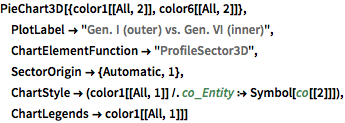
Compare colors of Pokémon in original (Generation I) and newest (Generation VI) groups.
