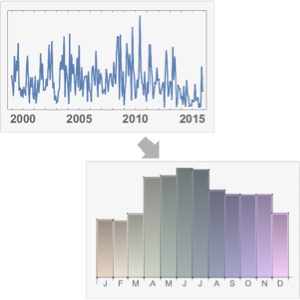
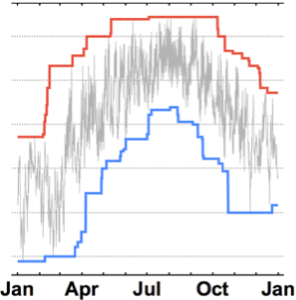
Visualice patrones estacionales
Compare la precipitación estacional en una región central y en una zona suroeste.
WeatherData proporciona la precipitación agregada en cm.
In[1]:=
start = {1999, 1, 1};
end = {2015, 12, 31};
In[2]:=
getData[place_] :=
 WeatherData[place, "TotalPrecipitation", {start, end, "Month"}]
Cree una TimeSeries de precipitaciones para Champaign, IL, y Phoenix, AZ. Especifique MissingDataMethod para usar la interpolación para completar los datos faltantes.
In[3]:=
makeTS[place_] :=
 TimeSeries[getData[place], MissingDataMethod -> "Interpolation"]
In[4]:=
tsIL = makeTS[
  Entity["City", {"Champaign", "Illinois", "UnitedStates"}]]
Out[4]=
In[5]:=
tsAZ = makeTS[Entity["City", {"Phoenix", "Arizona", "UnitedStates"}]]Out[5]=
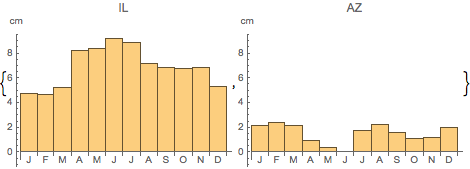
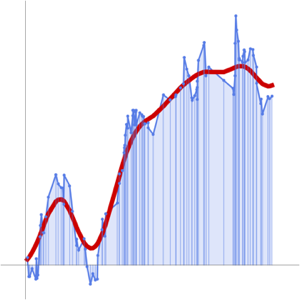
Cree WeightedData con cantidades de precipitación como ponderaciones y grafique un DateHistogram promediando los datos sobre el total de años.
In[6]:=
dataIL = WeightedData[tsIL["Dates"], tsIL["Values"]];
dataAZ = WeightedData[tsAZ["Dates"], tsAZ["Values"]];
In[7]:=
totalyears = (end[[1]] - start[[1]] + 1);In[8]:=
avg := Function[{x, y}, y/totalyears]In[9]:=
makeHistogram[data_, lab_] :=
 DateHistogram[data, "Month", avg, DateReduction -> "Year",
  PlotRange -> {All, {-1, 9}}, AxesLabel -> "cm", PlotLabel -> lab]
In[10]:=
{makeHistogram[dataIL, "IL"], makeHistogram[dataAZ, "AZ"]}Out[10]=