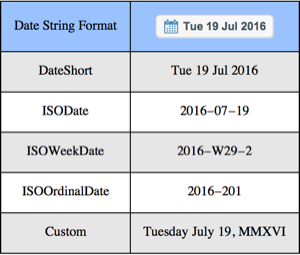
‹›単位と日付時刻帯の比較
中央部時刻帯のグリニッジ標準時からの現在の数値オフセットを得る.
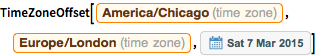
TimeZoneOffset[Entity["TimeZone", "America/Chicago"]]別の時刻帯との特定の日付における相対オフセットを得る.
TimeZoneOffset[Entity["TimeZone", "America/Chicago"],
Entity["TimeZone", "Europe/London"], DateObject[{2015, 3, 7}]]時刻帯領域の地理表現を得る.
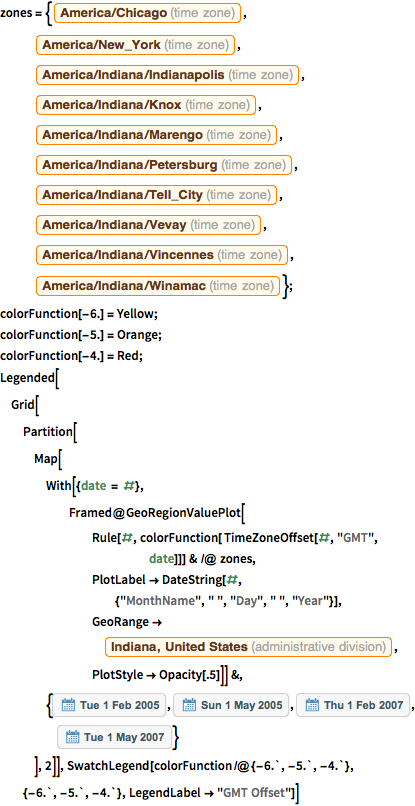
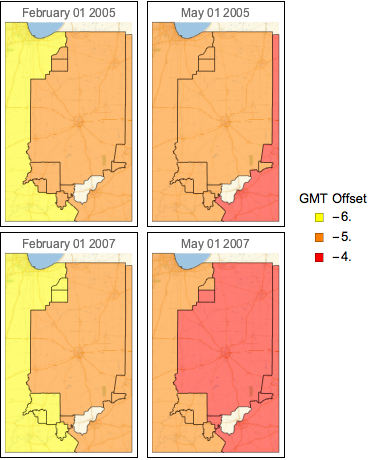
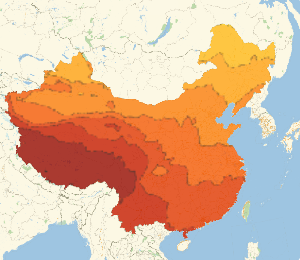
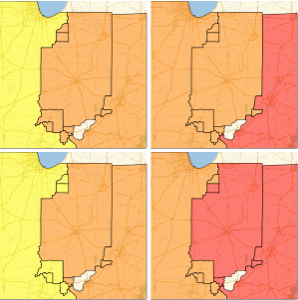
GeoGraphics[{Orange, Polygon[Entity["TimeZone", "Europe/London"]]}]インディアナ州のさまざまな地域における2つの日付間のオフセットの違いを比較する.
完全なWolfram言語入力を表示する
zones = {Entity["TimeZone", "America/Chicago"],
   Entity["TimeZone", "America/New_York"],
   Entity["TimeZone", "America/Indiana/Indianapolis"],
   Entity["TimeZone", "America/Indiana/Knox"],
   Entity["TimeZone", "America/Indiana/Marengo"],
   Entity["TimeZone", "America/Indiana/Petersburg"],
   Entity["TimeZone", "America/Indiana/Tell_City"],
   Entity["TimeZone", "America/Indiana/Vevay"],
   Entity["TimeZone", "America/Indiana/Vincennes"],
   Entity["TimeZone", "America/Indiana/Winamac"]};
colorFunction[-6.] = Yellow;
colorFunction[-5.] = Orange;
colorFunction[-4.] = Red;
Legended[Grid[
  Partition[
   Map[With[{date = #},
      Framed@GeoRegionValuePlot[
        Rule[#, colorFunction[ TimeZoneOffset[#, "GMT", date]]] & /@
         zones, PlotLabel ->
         DateString[#, {"MonthName", " ", "Day", " ", "Year"}],
        GeoRange ->
         Entity["AdministrativeDivision", {"Indiana",
           "UnitedStates"}],
        PlotStyle -> Opacity[.5]]] &, {DateObject[{2005, 2, 1}],
     DateObject[{2005, 5, 1}], DateObject[{2007, 2, 1}],
     DateObject[{2007, 5, 1}]}
    ], 2]],
 SwatchLegend[colorFunction /@ {-6., -5., -4.}, {-6., -5., -4.},
  LegendLabel -> "GMT Offset"]]