‹›单位和日期比较时区
获取中部时间相对于相对于格林尼治标准时间的数字偏移量.
TimeZoneOffset[Entity["TimeZone", "America/Chicago"]]获取指定日期时相对于不同时区的偏移量.
TimeZoneOffset[Entity["TimeZone", "America/Chicago"],
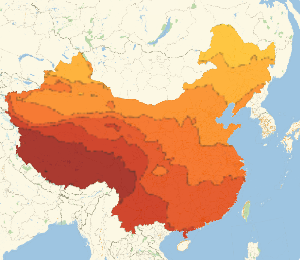
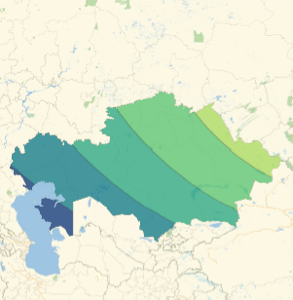
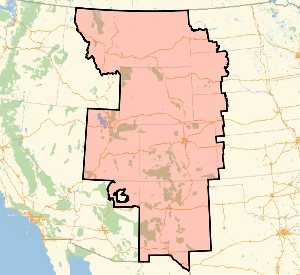
Entity["TimeZone", "Europe/London"], DateObject[{2015, 3, 7}]]获取时区区域的地理表示.
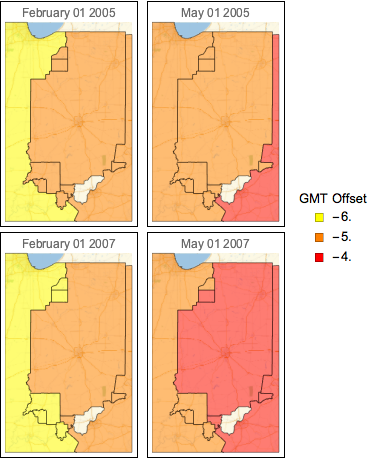
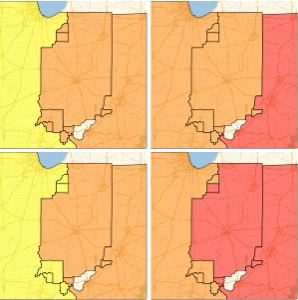
GeoGraphics[{Orange, Polygon[Entity["TimeZone", "Europe/London"]]}]比较两个日期间印第安纳州不同地方时区偏移量的不同.
显示完整的 Wolfram 语言输入
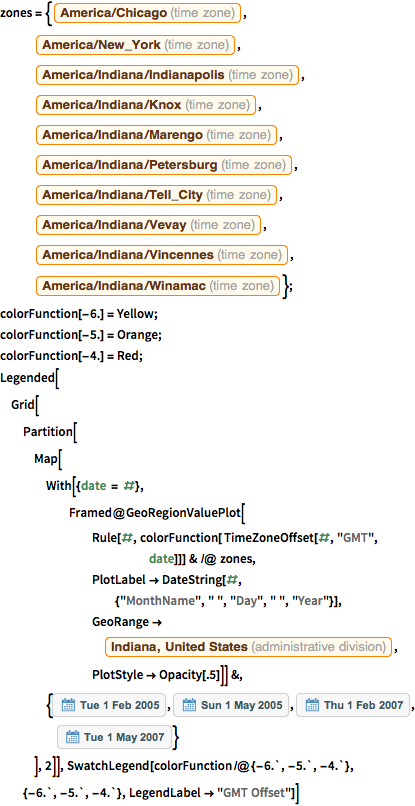
zones = {Entity["TimeZone", "America/Chicago"],
   Entity["TimeZone", "America/New_York"],
   Entity["TimeZone", "America/Indiana/Indianapolis"],
   Entity["TimeZone", "America/Indiana/Knox"],
   Entity["TimeZone", "America/Indiana/Marengo"],
   Entity["TimeZone", "America/Indiana/Petersburg"],
   Entity["TimeZone", "America/Indiana/Tell_City"],
   Entity["TimeZone", "America/Indiana/Vevay"],
   Entity["TimeZone", "America/Indiana/Vincennes"],
   Entity["TimeZone", "America/Indiana/Winamac"]};
colorFunction[-6.] = Yellow;
colorFunction[-5.] = Orange;
colorFunction[-4.] = Red;
Legended[Grid[
  Partition[
   Map[With[{date = #},
      Framed@GeoRegionValuePlot[
        Rule[#, colorFunction[ TimeZoneOffset[#, "GMT", date]]] & /@
         zones, PlotLabel ->
         DateString[#, {"MonthName", " ", "Day", " ", "Year"}],
        GeoRange ->
         Entity["AdministrativeDivision", {"Indiana",
           "UnitedStates"}],
        PlotStyle -> Opacity[.5]]] &, {DateObject[{2005, 2, 1}],
     DateObject[{2005, 5, 1}], DateObject[{2007, 2, 1}],
     DateObject[{2007, 5, 1}]}
    ], 2]],
 SwatchLegend[colorFunction /@ {-6., -5., -4.}, {-6., -5., -4.},
  LegendLabel -> "GMT Offset"]]