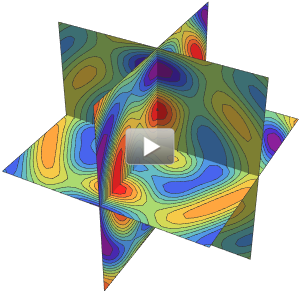
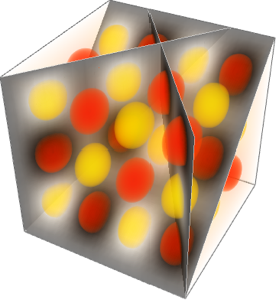
Plans personnalisés
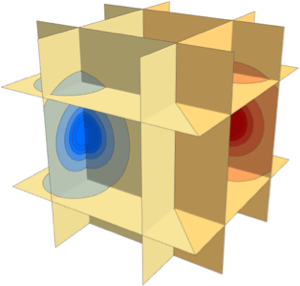
Spécifiez les coupes à utiliser pour le sous-échantillonnage du volume en tant qu'équations.
Afficher l'entrée complète de Wolfram Language
In[2]:=
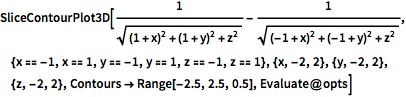
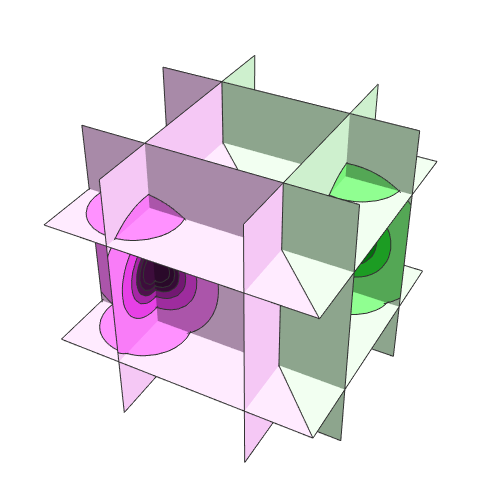
SliceContourPlot3D[
 1/Sqrt[(1 + x)^2 + (1 + y)^2 + z^2] - 1/
  Sqrt[(-1 + x)^2 + (-1 + y)^2 + z^2], {x == -1, x == 1, y == -1,
  y == 1, z == -1, z == 1}, {x, -2, 2}, {y, -2, 2}, {z, -2, 2},
 Contours -> Range[-2.5, 2.5, 0.5], Evaluate@opts]
Out[2]=