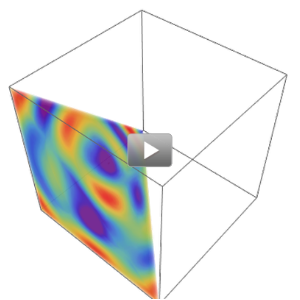
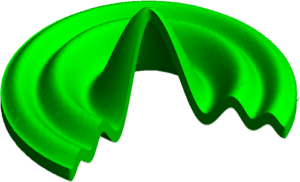
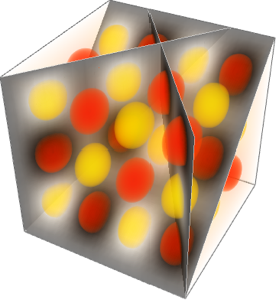
Volumes intégrés
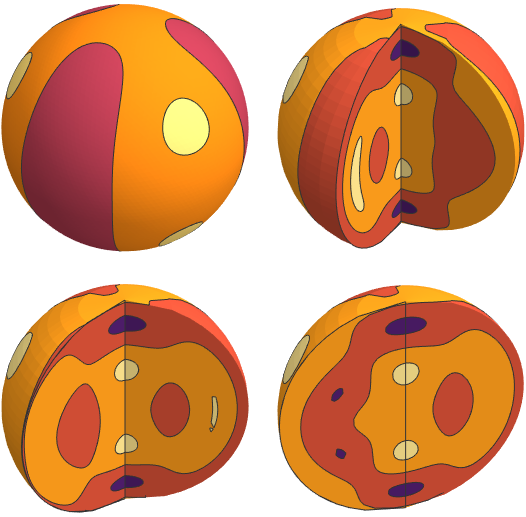
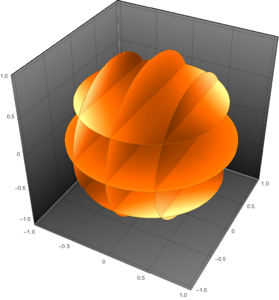
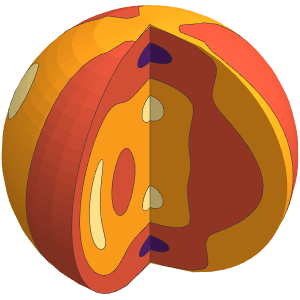
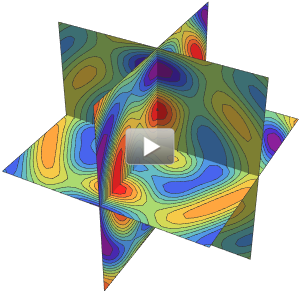
Utilisez des sphères dont les secteurs de taille variable ont été enlevés en tant que coupes de surface pour un tracé de contour.
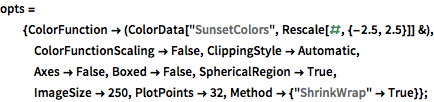
Afficher l'entrée complète de Wolfram Language
In[2]:=
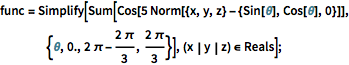
func = Simplify[
   Sum[Cos[5 Norm[{x, y, z} - {Sin[\[Theta]], Cos[\[Theta]],
         0}]], {\[Theta], 0., 2 \[Pi] - (2 \[Pi])/3, (2 \[Pi])/
     3}], (x | y | z) \[Element] Reals];
In[3]:=
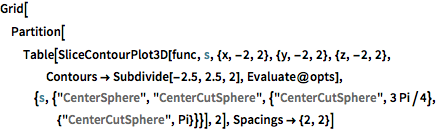
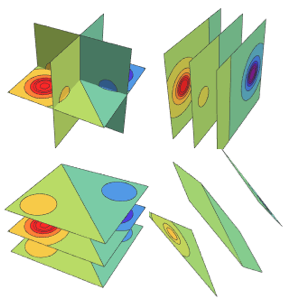
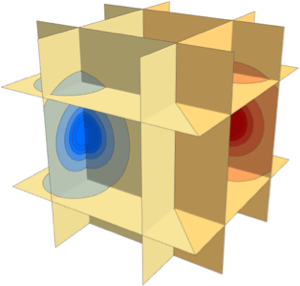
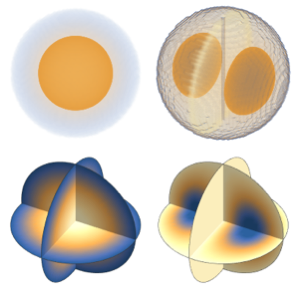
Grid[Partition[
  Table[SliceContourPlot3D[func,
    s, {x, -2, 2}, {y, -2, 2}, {z, -2, 2},
    Contours -> Subdivide[-2.5, 2.5, 2],
    Evaluate@opts], {s, {"CenterSphere",
     "CenterCutSphere", {"CenterCutSphere",
      3 Pi/4}, {"CenterCutSphere", Pi}}}], 2], Spacings -> {2, 2}]
Out[3]=