Color Countries by GDP
Make a world map with countries colored by GDP.
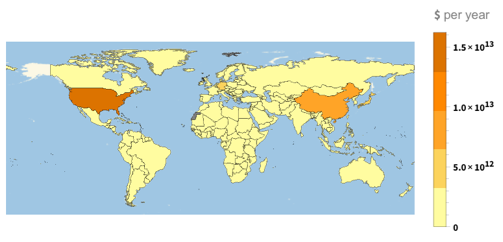
code
GeoRegionValuePlot[CountryData[] -> "GDP"]
Make a map of just South America:
GeoRegionValuePlot[CountryData["SouthAmerica"] -> "GDP"]
how it works
This example was live-coded at the Wolfram Research booth at SXSW, March 9, 2014.
Evaluating CountryData without arguments returns a list of countries. Here is that list in abbreviated form:
CountryData[] // Short
This makes a map showing each of the countries in that list colored by GDP:
GeoRegionValuePlot[CountryData[] -> "GDP"]
Specify the region to make a plot of a smaller area:
GeoRegionValuePlot[CountryData["SouthAmerica"] -> "GDP"]