Examine Seasonal Temperatures
Plot long-term temperatures to understand yearly patterns.
code
WeatherData["Austin", "Temperature", {{1980, 1, 1}, {2013, 12, 31},
"Month"}]
DateListPlot[%]
how it works
This example was live-coded at the Wolfram Research booth at SXSW, March 10, 2014.
Get monthly temperatures for Austin, Texas from 1980 through 2013:
WeatherData["Austin", "Temperature", {{1980, 1, 1}, {2013, 12, 31},
"Month"}]
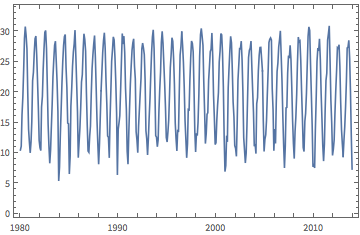
Plot the temperatures. “%” refers to the previous output:
DateListPlot[%]