Make a Table of Graphs
Show graphs of increasing complexity in a table. This example appears in Stephen Wolfram’s video Introduction to the Wolfram Language.
code
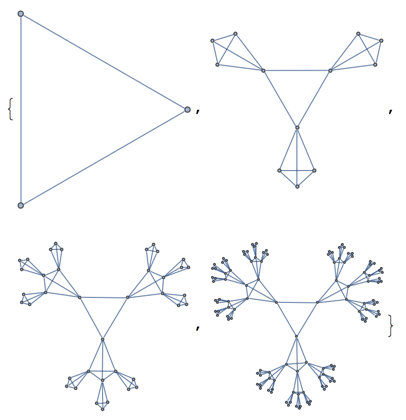
Table[LineGraph[CompleteKaryTree[n, 3]], {n, 2, 5}]
how it works
This expression gives a list of depth-n trees that have three children at each level.
Table[CompleteKaryTree[n, 3], {n, 2, 5}]
Applying LineGraph to the trees gives graphs whose vertices correspond to the edges of the trees. Vertices in a line graph are connected if the corresponding edges in the tree share a vertex.
Table[LineGraph[CompleteKaryTree[n, 3]], {n, 2, 5}]