 Open live version
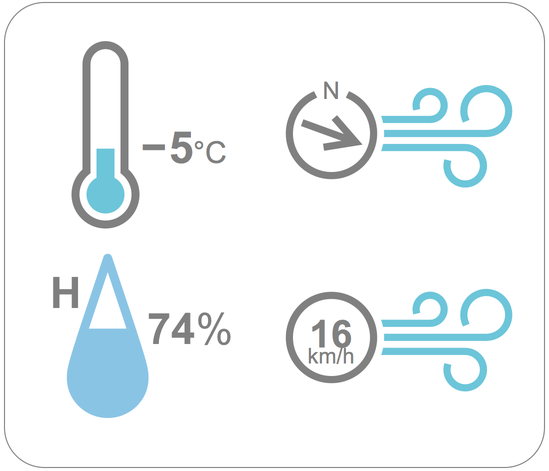
Make a Weather Dashboard
A simple, web-deployed weather dashboard. Visit a URL in the Wolfram Cloud for the current weather conditions at your location.
code
WeatherDashboard[temperature_, relativeHumidity_, windDirection_,
windSpeed_] :=
With[{scale = 2, tempSize = 100, humiditySize = 100,
windSize = 120},
Framed[
Grid[{
{
Row[{Spacer[15 scale],
Show[IconData["AirTemperature", temperature],
ImageSize -> tempSize scale]}],
Show[IconData["WindDirection", windDirection],
ImageSize -> windSize scale]
},
{
Show[IconData["RelativeHumidity", relativeHumidity],
ImageSize -> humiditySize scale],
Show[IconData["WindSpeed", windSpeed],
ImageSize -> windSize scale]
}
}],
RoundingRadius -> 20 scale, FrameMargins -> 15 scale,
FrameStyle -> Gray, ImageMargins -> 50
]
]
WeatherDashboard[location_] :=
WeatherDashboard[
WeatherData[location, "Temperature"],
WeatherData[location, "Humidity"],
WeatherData[location, "WindDirection"],
WeatherData[location, "WindSpeed"]
]
CloudDeploy[APIFunction[{}, WeatherDashboard[$GeoLocation] &, "PNG"],
Permissions -> "Public"]
how it works
IconData and WeatherData work together to make it trivially easy to depict current weather conditions in iconic form. The temperature at your current location, for example, is given by:
WeatherData[$GeoLocation, "Temperature"]
To depict that iconically, wrap WeatherData with IconData:
IconData["AirTemperature", WeatherData[$GeoLocation, "Temperature"]]
Make a function to arrange weather icons in a nicely formatted, framed grid using Frame and Grid, and adjust sizes and spacing with Spacer and ImageSize:
WeatherDashboard[temperature_, relativeHumidity_, windDirection_,
windSpeed_] :=
With[{scale = 2, tempSize = 100, humiditySize = 100,
windSize = 120},
Framed[
Grid[{
{
Row[{Spacer[15 scale],
Show[IconData["AirTemperature", temperature],
ImageSize -> tempSize scale]}],
Show[IconData["WindDirection", windDirection],
ImageSize -> windSize scale]
},
{
Show[IconData["RelativeHumidity", relativeHumidity],
ImageSize -> humiditySize scale],
Show[IconData["WindSpeed", windSpeed],
ImageSize -> windSize scale]
}
}],
RoundingRadius -> 20 scale, FrameMargins -> 15 scale,
FrameStyle -> Gray, ImageMargins -> 50
]
]
To make a dashboard that reflects current conditions at a given location, define a variant of WeatherDashboard whose argument is a location:
WeatherDashboard[location_] :=
WeatherDashboard[
WeatherData[location, "Temperature"],
WeatherData[location, "Humidity"],
WeatherData[location, "WindDirection"],
WeatherData[location, "WindSpeed"]
]
Finally, deploy the dashboard to the Wolfram Cloud as an instant API using APIFunction. In the cloud, $GeoLocation is automatically set to the location of the visitor. Click the link in the output expression to visit the deployed dashboard.
CloudDeploy[APIFunction[{}, WeatherDashboard[$GeoLocation] &, "PNG"],
Permissions -> "Public"]