Live Version Coming Soon
Check out other examples
Make a You-Centric World Map
Choose a projection and make a map of the world centered at your location.
code
Partition[
Labeled[
GeoGraphics[{}, GeoProjection -> #, GeoCenter -> $GeoLocation,
GeoRange -> "World", GeoGridLines -> Automatic],
#
] & /@ RandomSample[GeoProjectionData["Spherical"], 32],
4
] // Grid
how it works
This example was live-coded at the Wolfram Research booth at SXSW, March 9, 2014.
The Wolfram Language has a wealth of built-in map projections:
projections = GeoProjectionData["Spherical"]
Here is a world map in a Mercator projection centered at my location:
GeoGraphics[{}, GeoProjection -> "Mercator",
GeoCenter -> $GeoLocation, GeoRange -> "World",
GeoGridLines -> Automatic]
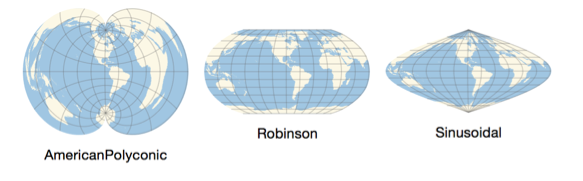
Here is the same map in an American Polyconic projection:
GeoGraphics[{}, GeoProjection -> "AmericanPolyconic",
GeoCenter -> $GeoLocation, GeoRange -> "World",
GeoGridLines -> Automatic]
And here is the same projection, this time centered at Timbuktu:
GeoGraphics[{}, GeoProjection -> "AmericanPolyconic",
GeoCenter -> Entity["City", {"Timbuktu", "Tombouctou", "Mali"}],
GeoRange -> "World", GeoGridLines -> Automatic]
How do the various projections compare? Make a table showing 32 of them at once:
maps = Labeled[
GeoGraphics[{}, GeoProjection -> #, GeoCenter -> $GeoLocation,
GeoRange -> "World", GeoGridLines -> Automatic],
#
] & /@ RandomSample[projections, 32];
Partition[maps, 4] // Grid