Make an Elevation Map
See the lay of the land with an elevation map.
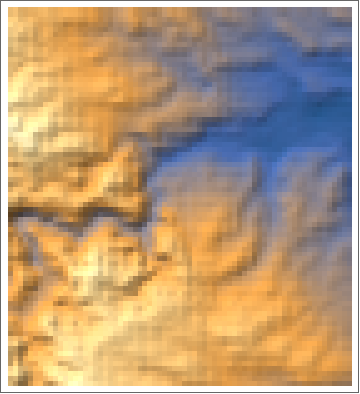
code
ReliefPlot[
QuantityMagnitude[
GeoElevationData[
Entity["City", {"Austin", "Texas", "UnitedStates"}]]]]
Make a topographic map with ListContourPlot:
ListContourPlot[
QuantityMagnitude[
GeoElevationData[
Entity["City", {"Austin", "Texas", "UnitedStates"}]]],
Contours -> 50]
how it works
This example was live-coded at the Wolfram Research booth at SXSW, March 9, 2014.
Get elevation data for Austin, Texas:
elevationData =
GeoElevationData[
Entity["City", {"Austin", "Texas", "UnitedStates"}]];
Extract pure quantity values from the data:
elevations = QuantityMagnitude[elevationData];
Plot the elevations as a relief map:
ReliefPlot[elevations]
Make a topographic map with ListContourPlot:
ListContourPlot[elevations, Contours -> 25]