Map Population Distributions
Color a map by the populations of administrative divisions.
code
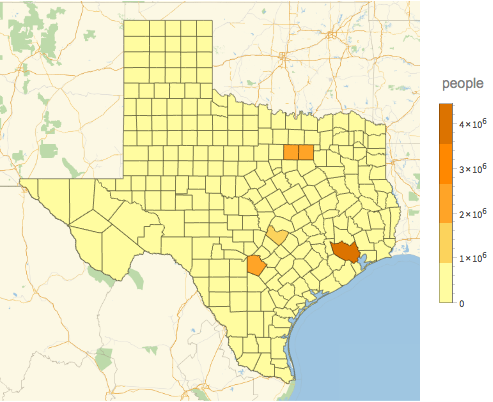
GeoRegionValuePlot[
EntityClass["AdministrativeDivision", "USCountiesTexas"] ->
"Population"]
how it works
This example was live-coded at the Wolfram Research booth at SXSW, March 12, 2014.
Make a map where administrative divisions are colored by population:
GeoRegionValuePlot[
EntityClass["AdministrativeDivision", "USCountiesTexas"] ->
"Population"]