 Open live version
Visualize Celebrity Gossip
Make networks of celebrity popularity and connections based on analyses of Wikipedia page traffic.
code
waw[a_] :=
WolframAlpha[
a, {{"PopularityPod:WikipediaStatsData", 1}, "TimeSeriesData"}][[
All, 2, 1]]
acts = {"Brad Pitt", "Angelina Jolie", "Nicole Kidman",
"Jennifer Aniston", "Katie Holmes",
"Tom Cruise", "Blake Lively", "Ryan Reynolds", "Bradley Cooper",
"Jennifer Lawrence",
"Gwyneth Paltrow", "Robert Downey Jr", "Daniel Craig",
"Rachel Weisz", "Scarlett Johansson"};
faces = ParallelMap[
WolframAlpha[#, {{"Image:PeopleData", 1}, "Content"}] &, acts];
Grid[Partition[MapThread[Labeled, {faces, acts}], 5],
Spacings -> {0, Automatic}]
data = ParallelMap[waw, acts];
vs = Rescale[Total /@ data];
corr = Outer[Correlation, data, data, 1];
MatrixPlot[corr, ColorFunction -> "Rainbow", FrameTicks -> {
{#, #} &[Transpose[{Range[Length[#]], #} &@acts]],
{#, #} &[
Transpose[{Range[Length[#]], Rotate[#, Pi/2] & /@ #} &@acts]]
}, PlotLegends -> Automatic, Mesh -> All,
MeshStyle -> Directive[Opacity[.2], Dashed],
ImageSize -> 400]
am = Round[UnitStep[# - .4] # &[corr], .001] /. {1. -> \[Infinity],
0. -> \[Infinity]};
g = WeightedAdjacencyGraph[acts, am,
VertexLabels -> Placed["Name", Below],
VertexSize -> Thread[acts -> vs^1],
GraphLayout -> "LayeredDigraphEmbedding"];
CommunityGraphPlot[#, FindGraphCommunities[#],
CommunityRegionStyle -> Directive[Opacity[.2], Gray],
CommunityBoundaryStyle -> Directive[Orange, Dashed],
Method -> "Hierarchical", ImageSize -> 500] &@g
how it works
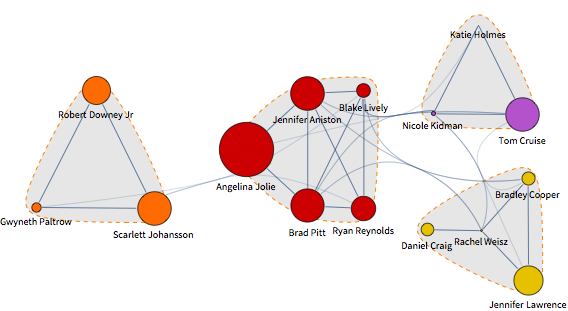
Anyone even a tiny bit savvy in celebrity gossip would group together Angelina Jolie and Brad Pitt because of family relationships and the film they made together. This grouping can be deduced by applying statistics and graph theory to data on visits to the Wikipedia pages of the celebrities in question. If visits to one celebrity’s web page are correlated with visits to another’s, you can infer that there is a connection between them in the public mind.
Here is a list of actors and actresses:
acts = {"Brad Pitt", "Angelina Jolie", "Nicole Kidman",
"Jennifer Aniston", "Katie Holmes",
"Tom Cruise", "Blake Lively", "Ryan Reynolds", "Bradley Cooper",
"Jennifer Lawrence",
"Gwyneth Paltrow", "Robert Downey Jr", "Daniel Craig",
"Rachel Weisz", "Scarlett Johansson"};
Their portraits can be pulled from Wolfram|Alpha. Use ParallelMap to take full advantage of multiple cores in your computer to speed things up:
faces = ParallelMap[
WolframAlpha[#, {{"Image:PeopleData", 1}, "Content"}] &, acts];
Here’s a gallery of the celebrities we’re dealing with:
Grid[Partition[MapThread[Labeled, {faces, acts}], 5],
Spacings -> {0, Automatic}]
This function retrieves time series data on how often a given celebrity’s Wikipedia page is visited per day:
waw[a_] :=
WolframAlpha[
a, {{"PopularityPod:WikipediaStatsData", 1}, "TimeSeriesData"}][[
All, 2, 1]]
Use that function to get page-hit data for all of the celebrities in the list. Again, using ParallelMap will speed things up if you are working on a multi-core machine:
data = ParallelMap[waw, acts];
Compute the Pearson’s cross-correlation coefficient between all pairs of celebrities. The result is a matrix whose {i, j} entry is the correlation between celebrities i and j:
corr = Outer[Correlation, data, data, 1];
Visualize the correlation with a heat map where red indicates a strong connection and green a weak one:
MatrixPlot[corr, ColorFunction -> "Rainbow", FrameTicks -> {
{#, #} &[Transpose[{Range[Length[#]], #} &@acts]],
{#, #} &[
Transpose[{Range[Length[#]], Rotate[#, Pi/2] & /@ #} &@acts]]
}, PlotLegends -> Automatic, Mesh -> All,
MeshStyle -> Directive[Opacity[.2], Dashed],
ImageSize -> 400]
To make a network of celebrity connections, first prepare a weighted adjacency matrix.
A Pearson’s correlation coefficient higher than 0.4 indicates a strong positive relationship. Assume no connection for values lower than that. Replace 0 values, and 1 values resulting from self-correlation, by infinity—a convention for absent edges in weighted adjacency matrices.
am = Round[UnitStep[# - .4] # &[corr], .001] /. {1. -> \[Infinity],
0. -> \[Infinity]};
Make a network from the matrix, assigning vertex sizes by relative popularity, as indicated by the total number of Wikipedia page visits:
vs = Rescale[Total /@ data]
g = WeightedAdjacencyGraph[acts, am,
VertexLabels -> Placed["Name", Below],
VertexSize -> Thread[acts -> vs],
GraphLayout -> "LayeredDigraphEmbedding", ImageSize -> 500]
Gain more insight into who groups with whom by making a network of communities within that network:
CommunityGraphPlot[#, FindGraphCommunities[#],
CommunityRegionStyle -> Directive[Opacity[.2], Gray],
CommunityBoundaryStyle -> Directive[Orange, Dashed],
Method -> "Hierarchical", ImageSize -> 500] &@g