単位付きの分布からの順序分布
あるシステムには3つのコンポーネントが含まれる.そのうちの1つが主要コンポーネントであり,2つは冗長コンポーネントである.それぞれのコンポーネントの寿命は,形状母数が2,平均寿命が885時間であるWeibullDistributionに従う.
In[1]:=
{sol} = NSolve[
  Mean[WeibullDistribution[2, b]] == Quantity[885, "Hours"], b]
Out[1]=
In[2]:=
\[ScriptD] = WeibullDistribution[2, b] /. solOut[2]=
このシステムの寿命は,そのコンポーネントの最大寿命としてあらわすことができる.
In[3]:=
\[ScriptCapitalD] = OrderDistribution[{\[ScriptD], 3}, 3]Out[3]=
システムの平均寿命.
In[4]:=
Mean[\[ScriptCapitalD]]Out[4]=
ReliabilityDistributionを使った計算と比べる.
In[5]:=
Mean[ReliabilityDistribution[
  comp1 \[Or] comp2 \[Or]
   comp3, {{comp1, \[ScriptD]}, {comp2, \[ScriptD]}, {comp3, \
\[ScriptD]}}]]
Out[5]=
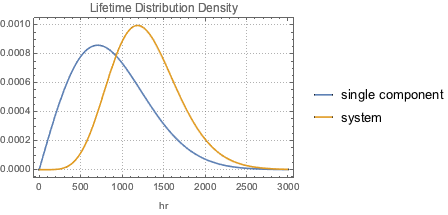
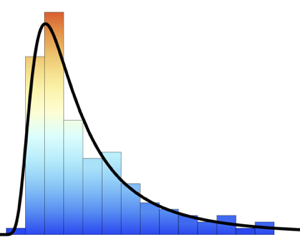
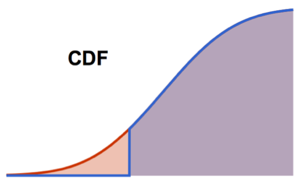
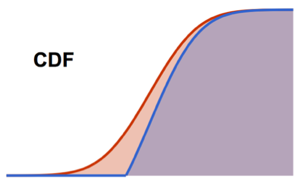
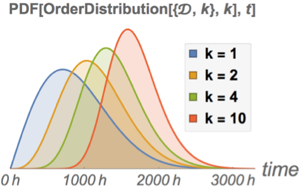
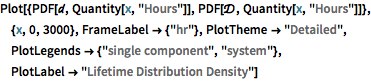
単一のコンポーネントの寿命の確率密度関数を,システムの寿命の確率密度関数と比べる.
完全なWolfram言語入力を表示する
Out[6]=