関数密度の可視化
3D関数の密度を可視化する.
In[1]:=
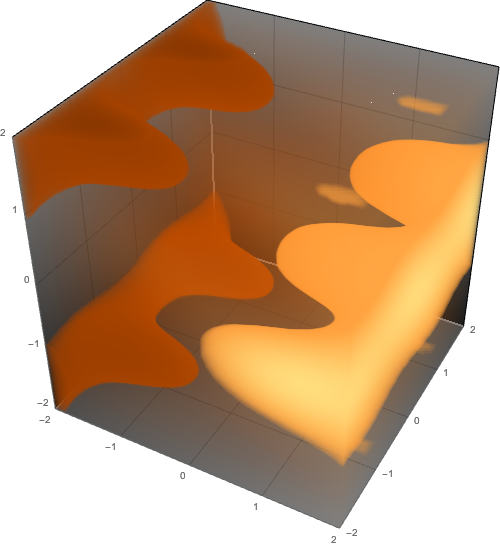
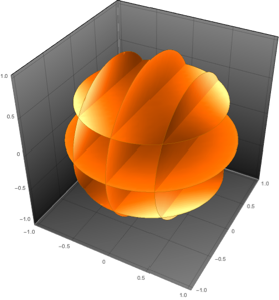
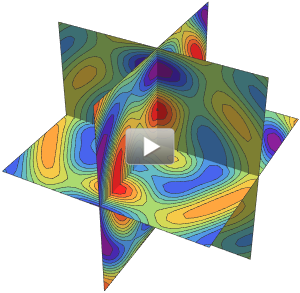
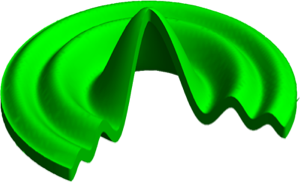
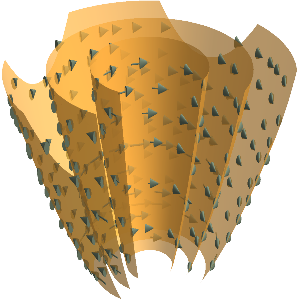
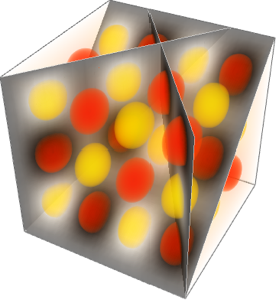
DensityPlot3D[
 Sin[5 x] Cos[3 y] + Cos[7 z], {x, -2, 2}, {y, -2, 2}, {z, -2, 2},
 PlotTheme -> "Web", ImageSize -> 500]
Out[1]=
In[2]:=
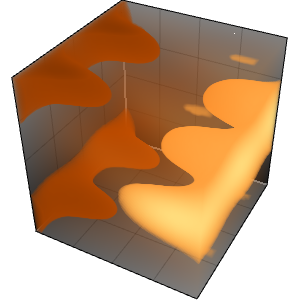
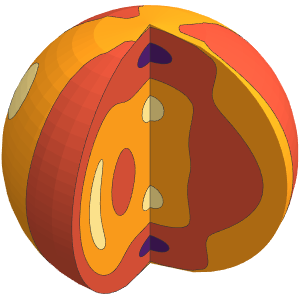
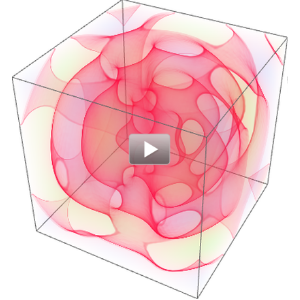
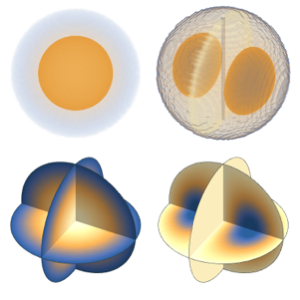
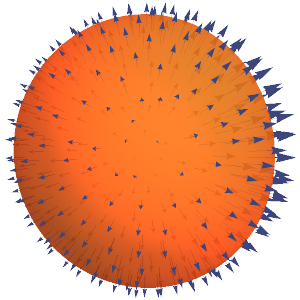
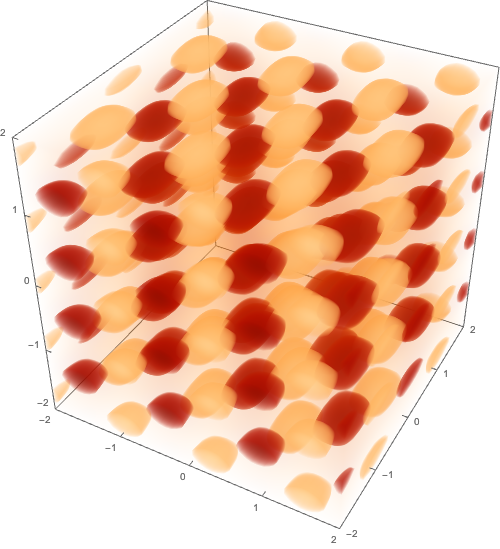
DensityPlot3D[
 Sin[ 1.5 x] Cos[3 y + 2 z] + x + Cos[2 z], {x, -2, 2}, {y, -2,
  2}, {z, -2, 2}, PlotTheme -> "Marketing", ImageSize -> 500]
Out[2]=