泊松点过程取样
泊松点过程是一维泊松过程到多维情况的推广. 齐次泊松过程在几何区域可通过 RandomPoint 进行取样.
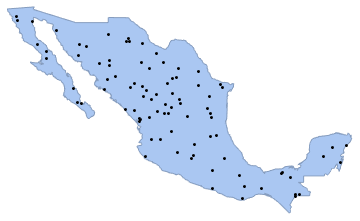
创建一个国家多边形.
In[1]:=
![Click for copyable input](assets.zh/sample-from-a-poisson-point-process/In_56.png)
region = DiscretizeGraphics[CountryData["Mexico", "Polygon"],
ImageSize -> Medium]
Out[1]=
![](assets.zh/sample-from-a-poisson-point-process/O_46.png)
定义一个从包含区域、密度和实现数目三个参数的泊松点过程中取样的函数.
In[2]:=
![Click for copyable input](assets.zh/sample-from-a-poisson-point-process/In_57.png)
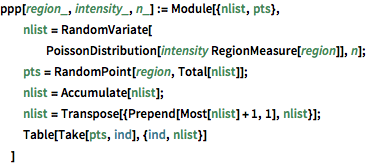
ppp[region_, intensity_, n_] := Module[{nlist, pts},
nlist =
RandomVariate[PoissonDistribution[intensity RegionMeasure[region]],
n];
pts = RandomPoint[region, Total[nlist]];
nlist = Accumulate[nlist];
nlist = Transpose[{Prepend[Most[nlist] + 1, 1], nlist}];
Table[Take[pts, ind], {ind, nlist}]
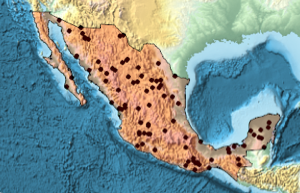
]
在国家多边形中生成密度为 0.5 的泊松点过程的一个实现,并用 Graphics 对其可视化.
In[3]:=
![Click for copyable input](assets.zh/sample-from-a-poisson-point-process/In_58.png)
intensity = 0.5;
sample = ppp[region, intensity, 1];
In[4]:=
![Click for copyable input](assets.zh/sample-from-a-poisson-point-process/In_59.png)
Show[region, Graphics[{Black, Point @@ sample}]]
Out[4]=
![](assets.zh/sample-from-a-poisson-point-process/O_47.png)
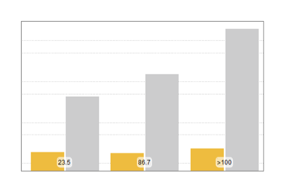
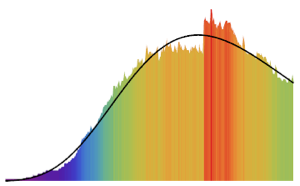
从同样的过程中生成 104个样本. 每个样本中的点的总数满足 PoissonDistribution,其中均值等于强度乘以区域的面积.
In[5]:=
![Click for copyable input](assets.zh/sample-from-a-poisson-point-process/In_60.png)
samples = ppp[region, intensity, 10^4];
counts = Length /@ samples;
In[6]:=
![Click for copyable input](assets.zh/sample-from-a-poisson-point-process/In_61.png)
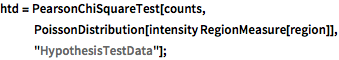
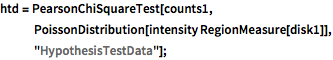
htd = PearsonChiSquareTest[counts,
PoissonDistribution[intensity RegionMeasure[region]],
"HypothesisTestData"];
In[7]:=
![Click for copyable input](assets.zh/sample-from-a-poisson-point-process/In_62.png)
htd["TestDataTable"]
Out[7]=
![](assets.zh/sample-from-a-poisson-point-process/O_48.png)
In[8]:=
![Click for copyable input](assets.zh/sample-from-a-poisson-point-process/In_63.png)
htd["TestConclusion"]
Out[8]=
![](assets.zh/sample-from-a-poisson-point-process/O_49.png)
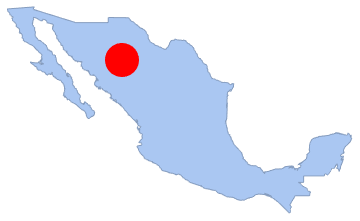
在任何子区域中的点数目也为泊松分布. 这里,通过区域上的一个圆盘并计算其上的点数进行验证.
In[9]:=
![Click for copyable input](assets.zh/sample-from-a-poisson-point-process/In_64.png)
disk1 = Disk[{-107, 28}, 1.5];
Show[region, Graphics[{Red, disk1}]]
Out[9]=
![](assets.zh/sample-from-a-poisson-point-process/O_50.png)
In[10]:=
![Click for copyable input](assets.zh/sample-from-a-poisson-point-process/In_65.png)
memberfun1 = RegionMember[disk1];
counts1 = Table[Total[Boole[memberfun1[pts]]], {pts, samples}];
用一个泊松分布,对该点数执行 PearsonChiSquareTest(皮尔森卡方检验).
In[11]:=
![Click for copyable input](assets.zh/sample-from-a-poisson-point-process/In_66.png)
htd = PearsonChiSquareTest[counts1,
PoissonDistribution[intensity RegionMeasure[disk1]],
"HypothesisTestData"];
In[12]:=
![Click for copyable input](assets.zh/sample-from-a-poisson-point-process/In_67.png)
htd["TestDataTable"]
Out[12]=
![](assets.zh/sample-from-a-poisson-point-process/O_51.png)
In[13]:=
![Click for copyable input](assets.zh/sample-from-a-poisson-point-process/In_68.png)
htd["TestConclusion"]
Out[13]=
![](assets.zh/sample-from-a-poisson-point-process/O_52.png)
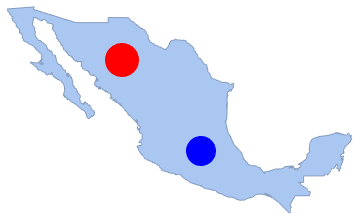
在任何不连接的子区域中的点的数目是独立的. 在此,计算两个不连接圆盘中的点的数目并执行 SpearmanRankTest(斯皮尔曼等级检验).
In[14]:=
![Click for copyable input](assets.zh/sample-from-a-poisson-point-process/In_69.png)
disk2 = Disk[{-100, 20}, 1.3];
Show[region, Graphics[{Red, disk1, Blue, disk2}]]
Out[14]=
![](assets.zh/sample-from-a-poisson-point-process/O_53.png)
In[15]:=
![Click for copyable input](assets.zh/sample-from-a-poisson-point-process/In_70.png)
memberfun2 = RegionMember[disk2];
counts2 = Table[Total[Boole[memberfun2[pts]]], {pts, samples}];
In[16]:=
![Click for copyable input](assets.zh/sample-from-a-poisson-point-process/In_71.png)
htd = SpearmanRankTest[counts1, counts2, "HypothesisTestData"];
In[17]:=
![Click for copyable input](assets.zh/sample-from-a-poisson-point-process/In_72.png)
htd["TestDataTable"]
Out[17]=
![](assets.zh/sample-from-a-poisson-point-process/O_54.png)
In[18]:=
![Click for copyable input](assets.zh/sample-from-a-poisson-point-process/In_73.png)
htd["TestConclusion"]
Out[18]=
![](assets.zh/sample-from-a-poisson-point-process/O_55.png)