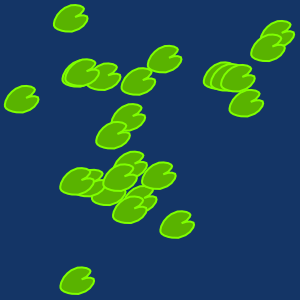
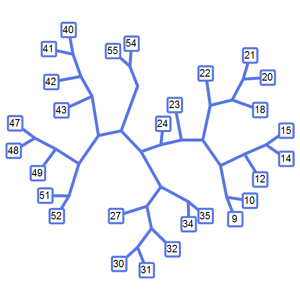
Trouvez des composantes de graphes connectés
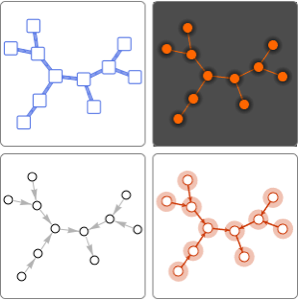
Modélisez le réseau de saut de la grenouille à partir de la densité des feuilles de nénuphars. La version 11 introduit les fonctions ConnectedGraphComponents et WeaklyConnectedGraphComponents pour l'analyse des connectivités d'un réseau.
Une grenouille dans un étang de nénuphars est capable de sauter une distance d'1,5 pied (0,45 mètre) pour aller de l'un des 25 nénuphars à l'autre.
In[1]:=
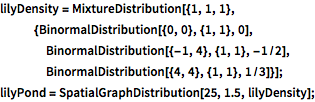
lilyDensity =
  MixtureDistribution[{1, 1,
    1}, {BinormalDistribution[{0, 0}, {1, 1}, 0],
    BinormalDistribution[{-1, 4}, {1, 1}, -1/2],
    BinormalDistribution[{4, 4}, {1, 1}, 1/3]}];
lilyPond = SpatialGraphDistribution[25, 1.5, lilyDensity];
Échantillonnez un étang aléatoire.
In[2]:=
g = RandomGraph[lilyPond, VertexShape -> \!\(\*
GraphicsBox[
{EdgeForm[{Hue[0.3277777777777778, 0.16216216216216217`, 1.], Opacity[
       1.], AbsoluteThickness[1], CapForm["Round"]}], FaceForm[Hue[
       0.2388888888888889, 1., 0.9224857536122444]],
       PolygonBox[CompressedData["
1:eJxTTMoPSmViYGCQAmIQDQYVhQ5gWiALQkeUQmiDPAj9ohxCcxRB6IwKCF1R
DKF3QOVnlKDqvwGlT0DNzyiD0AE5ENoCyr+QBOVD9StEoupz8IHqy4XQDeZQ
fiqEZtCG0AvioXxdVHMabKD8YKh5flDaG0I/iIbynaDuSYbqs4bQH2D2WkLo
Dqg7HXwh9A+o/xdEQOgZVVD3Qc2xqIbQE9Kh/oLKf4CFNzQ8N0DDBRZ+BTkO
ABBsOr4=
"]]},
ImageSize->{45., Automatic}]\), VertexSize -> {"Scaled", 0.1},
  EdgeStyle -> Opacity[0], Background -> Hue[0.6, 0.8, 0.4],
  ImageSize -> 150]
Out[2]=
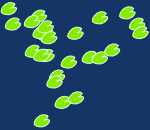
Trouvez la plus grande collection de nénuphars sur lesquels la grenouille peut sauter.
In[3]:=
VertexCount[First[ConnectedGraphComponents[g]]]Out[3]=
Trouvez le nombre de fois que la grenouille devrait nager pour visiter tous les nénuphars.
In[4]:=
Length[ConnectedGraphComponents[g]] - 1Out[4]=