‹›Ausbau der KnowledgebaseAufstieg und Niedergang historischer Länder animieren
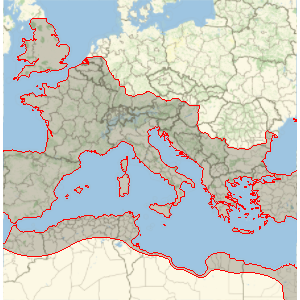
Version 11 enthält eine umfangreiche Sammlung an Polygonen zur Darstellung historischer Ländergrenzen, mit denen das territoriale Wachstum (und der Niedergang) vieler Nationalstaaten und Königreiche veranschaulicht werden kann.
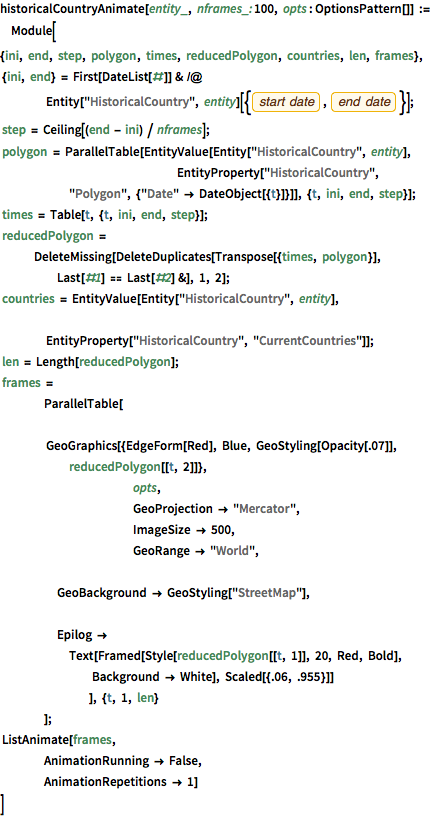
Den kompletten Wolfram Language-Input zeigen
historicalCountryAnimate[entity_, nframes_: 100,
  opts : OptionsPattern[]] := Module[
  {ini, end, step, polygon, times, reducedPolygon, countries, len,
   frames},
   {ini, end} =
   First[DateList[#]] & /@
    Entity["HistoricalCountry",
      entity][{EntityProperty["HistoricalCountry", "StartDate"],
      EntityProperty["HistoricalCountry", "EndDate"]}];
   step = Ceiling[(end - ini) / nframes];
   polygon =
   ParallelTable[EntityValue[Entity["HistoricalCountry", entity],
     				EntityProperty["HistoricalCountry",
      "Polygon", {"Date" -> DateObject[{t}]}]], {t, ini, end, step}];
   times = Table[t, {t, ini, end, step}];
   reducedPolygon =
   DeleteMissing[
    DeleteDuplicates[Transpose[{times, polygon}],
     Last[#1] == Last[#2] &], 1, 2];
   countries = EntityValue[Entity["HistoricalCountry", entity],
    				EntityProperty["HistoricalCountry", "CurrentCountries"]];
   len = Length[reducedPolygon];
   frames =
   	ParallelTable[
    		GeoGraphics[{EdgeForm[Red], Blue, GeoStyling[Opacity[.07]],
      reducedPolygon[[t, 2]]},
     			opts,
     			GeoProjection -> "Mercator",
     			ImageSize -> 500,
     			GeoRange -> "World",
     			GeoBackground -> GeoStyling["StreetMap"],
     			Epilog ->
      Text[Framed[Style[reducedPolygon[[t, 1]], 20, Red, Bold],
        Background -> White], Scaled[{.06, .955}]]
     		], {t, 1, len}
    	];
   ListAnimate[frames,
   	AnimationRunning -> False,
   	AnimationRepetitions -> 1]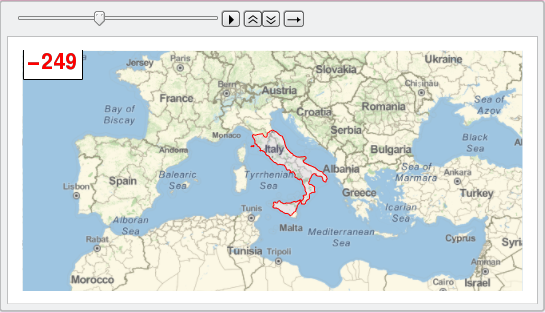
]historicalCountryAnimate["RomanRepublic", 100,
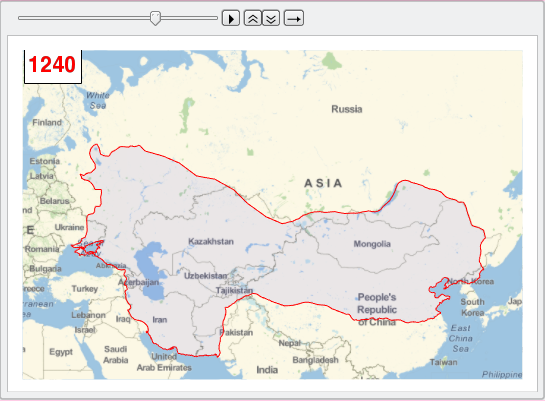
GeoRange -> {{30, 50}, {-15, 40}}]historicalCountryAnimate["MongolEmpire", 100,
GeoRange -> {{20, 70}, {20, 140}}]