Forecast the Weather
The Wolfram Knowledgebase contains not only static knowledge and real-time data, but also forecasts of future events such as those associated with the weather. This example retrieves forecasts using WeatherForecastData, compares them with historical values known to AirTemperatureData, and provides a number of visualizations of the results.
Return this week's forecasted mean temperatures for the capital of Greenland, specified using free-form input.
forecast = WeatherForecastData[\!\(\*
NamespaceBox["LinguisticAssistant",
DynamicModuleBox[{Typeset`query$$ = "greenland capital",
      Typeset`boxes$$ = RowBox[{
TemplateBox[{"\"Greenland\"",
RowBox[{"Entity", "[",
RowBox[{"\"Country\"", ",", "\"Greenland\""}], "]"}],
          "\"Entity[\\\"Country\\\", \\\"Greenland\\\"]\"",
          "\"country\""}, "Entity"], "[",
TemplateBox[{"\"capital city\"",
RowBox[{"EntityProperty", "[",
RowBox[{"\"Country\"", ",", "\"CapitalCity\""}], "]"}],
          "\"EntityProperty[\\\"Country\\\", \\\"CapitalCity\\\"]\""},
          "EntityProperty"], "]"}], Typeset`allassumptions$$ = {},
      Typeset`assumptions$$ = {}, Typeset`open$$ = {1},
      Typeset`querystate$$ = {
      "Online" -> True, "Allowed" -> True,
       "mparse.jsp" -> 0.449168`6.10395380181902, "Messages" -> {}}},

DynamicBox[ToBoxes[
AlphaIntegration`LinguisticAssistantBoxes["", 4, Automatic,
Dynamic[Typeset`query$$],
Dynamic[Typeset`boxes$$],
Dynamic[Typeset`allassumptions$$],
Dynamic[Typeset`assumptions$$],
Dynamic[Typeset`open$$],
Dynamic[Typeset`querystate$$]], StandardForm],
ImageSizeCache->{121., {7., 16.}},
TrackedSymbols:>{
        Typeset`query$$, Typeset`boxes$$, Typeset`allassumptions$$,
         Typeset`assumptions$$, Typeset`open$$, Typeset`querystate$$}],
DynamicModuleValues:>{},
UndoTrackedVariables:>{Typeset`open$$}],
BaseStyle->{"Deploy"},
DeleteWithContents->True,
Editable->False,
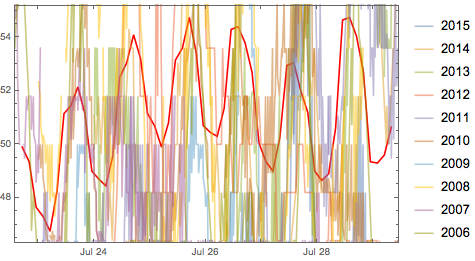
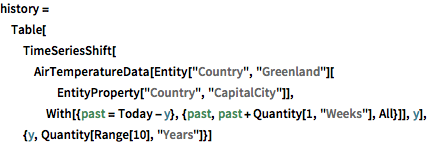
SelectWithContents->True]\), "Temperature"]Retrieve weekly mean temperatures over the past decade and compare with those of the prior 10 years.

Examine and contrast the difference in temperature ranges across regions surrounding two different cities.

Table[WeatherForecastData[
  GeoDisk[city[EntityProperty["City", "Position"]],
   Quantity[100, "Miles"]], "Temperature",
  DateObject[
   Tomorrow, {12}]], {city, {Entity[
    "City", {"Champaign", "Illinois", "UnitedStates"}],
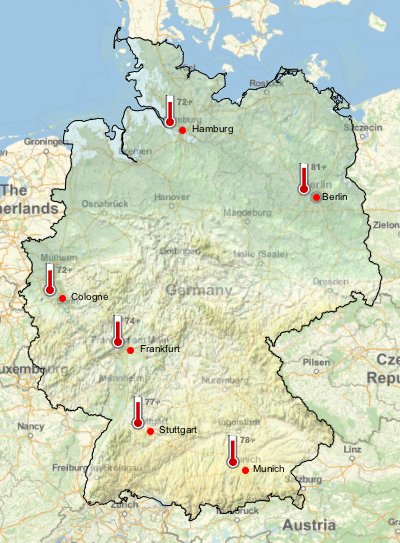
Entity["City", {"SanFrancisco", "California", "UnitedStates"}]}}]List the six largest cities in Germany and obtain today's forecast high temperatures for them.

cities = EntityClass[
   "City", {"Country" -> "Germany", "Population" -> TakeLargest[6]}] //
   EntityList
data = {CityData[#, "Coordinates"], CityData[#, "Name"],
     WeatherForecastData[#, "MaxTemperature"]["FirstValue"]} & /@
   cities;
Visualize on a map.


