유인 우주 미션
내장된 MannedSpaceMissionData는 과거에서 현재까지의 유인 우주 탐험에 대한 정보를 제공합니다.
In[1]:=
missions = MannedSpaceMissionData[];미션의 발사 날짜를 기준으로 EventSeries를 생성 할 수있습니다. 벡터값은 미션의 실체와 각 미션의 지속 기간을 나타냅니다.
In[2]:=
data = DeleteMissing[
   MannedSpaceMissionData[
    missions, {"LaunchDate", "Entity", "MissionDuration"}], 1, 2];
In[3]:=
es = EventSeries[data[[All, {2, 3}]], {data[[All, 1]]}]Out[3]=
타임 스탬프의 TimelinePlot은 1961년부터 유인 우주 미션이 거의 지속적으로 시행되었음을 보여줍니다.
In[4]:=
TimelinePlot[es["Dates"]]Out[4]=
미션 기간을 분석하기 위해 원래의 이벤트 시리즈에서 제 2의 요소를 추출하여 시간으로 값을 변환합니다.
In[5]:=
durations = UnitConvert[es["PathComponent", 2], "Hours"]Out[5]=
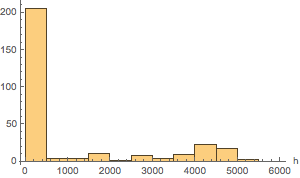
단기 미션이 가장 일반적임을 알수 있습니다.
In[6]:=
Histogram[durations, Quantity[{0, 6000, 500}, "Hours"],
 AxesLabel -> Automatic]
Out[6]=
전체 Wolfram 언어 입력 표시하기
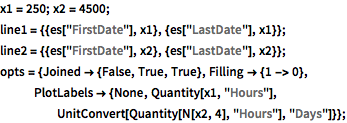
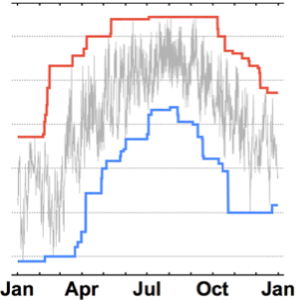
In[8]:=
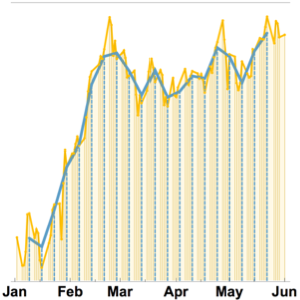
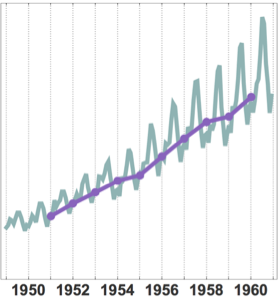
DateListPlot[{durations, line1, line2}, opts]Out[8]=
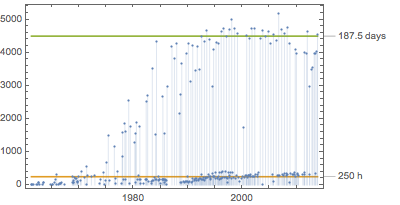
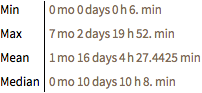
미션 기간의 기술 통계량을 계산합니다. 평균값과 중앙값이 크게 떨어져 있으며, 긴 꼬리 분포를 나타내고 있습니다.
In[9]:=
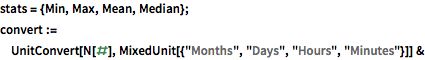
stats = {Min, Max, Mean, Median};
convert :=
 UnitConvert[N[#], MixedUnit[{"Months", "Days", "Hours", "Minutes"}]]
  &
In[10]:=
TableForm[Map[convert[#[durations]] &, stats],
 TableHeadings -> {stats}]
Out[10]//TableForm=
다음은 인류가 우주에 체류한 총 시간입니다.
In[11]:=
UnitConvert[Total[durations],
 MixedUnit[{"Years", "Months", "Days", "Hours", "Minutes",
   "Seconds"}]]
Out[11]=