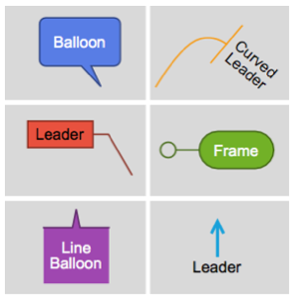
Контролирование меток выносок
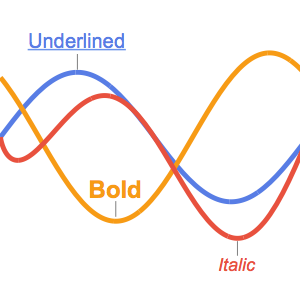
Задайте стиль шрифта для текста выносок.
In[1]:=
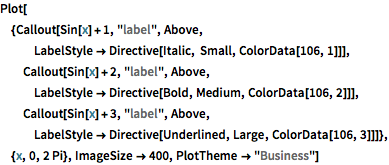
Plot[{Callout[Sin[x] + 1, "label", Above,
   LabelStyle -> Directive[Italic, Small, ColorData[106, 1]]],
  Callout[Sin[x] + 2, "label", Above,
   LabelStyle -> Directive[Bold, Medium, ColorData[106, 2]]],
  Callout[Sin[x] + 3, "label", Above,
   LabelStyle ->
    Directive[Underlined, Large, ColorData[106, 3]]]}, {x, 0, 2 Pi},
 ImageSize -> 400, PlotTheme -> "Business"]
Out[1]=
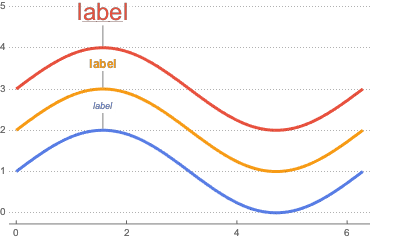
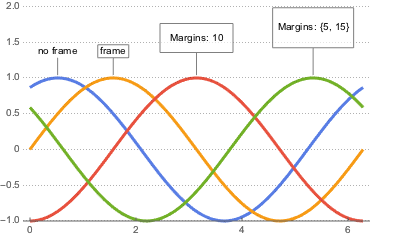
Задайте рамку меток и укажите размеры границ.
In[2]:=
Plot[{Callout[Sin[x + Pi/3], "no frame", Above],
  Callout[Sin[x], "frame", Above, Frame -> True],
  Callout[Sin[x - Pi/2], "Margins: 10", Above, Frame -> True,
   FrameMargins -> 10],
  Callout[Sin[x - 6 Pi/5], "Margins: {5, 15}", Above, Frame -> True,
   FrameMargins -> {5, 15}]}, {x, 0, 2 Pi}, ImageSize -> 400,
 PlotRange -> {-1, 2}, PlotTheme -> "Business"]
Out[2]=
Укажите радиус углов рамки.
In[3]:=
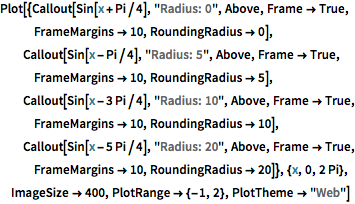
Plot[{Callout[Sin[x + Pi/4], "Radius: 0", Above, Frame -> True,
   FrameMargins -> 10, RoundingRadius -> 0],
  Callout[Sin[x - Pi/4], "Radius: 5", Above, Frame -> True,
   FrameMargins -> 10, RoundingRadius -> 5],
  Callout[Sin[x - 3 Pi/4], "Radius: 10", Above, Frame -> True,
   FrameMargins -> 10, RoundingRadius -> 10],
  Callout[Sin[x - 5 Pi/4], "Radius: 20", Above, Frame -> True,
   FrameMargins -> 10, RoundingRadius -> 20]}, {x, 0, 2 Pi},
 ImageSize -> 400, PlotRange -> {-1, 2}, PlotTheme -> "Web"]
Out[3]=
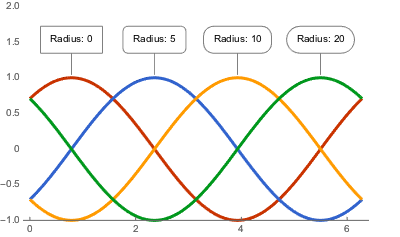
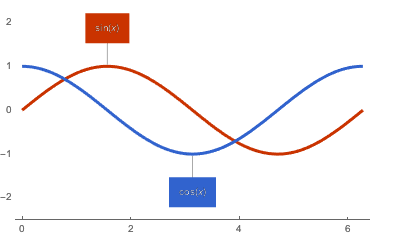
Укажите цвет для фона и текста.
In[4]:=
Plot[{Callout[Sin[x], Sin[x], Above,
   Background -> RGBColor[0.790588, 0.201176, 0], FrameMargins -> 10,
   RoundingRadius -> 10, LabelStyle -> Directive[10, White]],
  Callout[Cos[x], Cos[x], Below,
   Background -> RGBColor[0.192157, 0.388235, 0.807843],
   FrameMargins -> 10, RoundingRadius -> 10,
   LabelStyle -> Directive[10, White]]}, {x, 0, 2 Pi},
 PlotTheme -> "Web",
 PlotRangePadding -> {Automatic, {Scaled[0.3], Scaled[0.3]}}]
Out[4]=
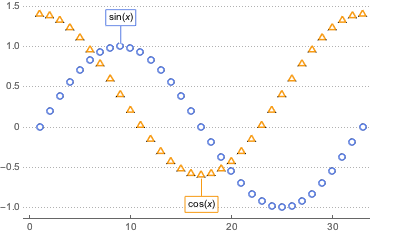
Укажите цвет для рамки и главной линии.
In[5]:=
ListPlot[{Callout[Table[Sin[x], {x, 0, 2 Pi, Pi/16}], Sin[x], Above,
   Frame -> True,
   CalloutStyle -> RGBColor[0.34398, 0.49112, 0.89936]],
  Callout[Table[.4 + Cos[x], {x, 0, 2 Pi, Pi/16}], Cos[x], Below,
   Frame -> True, CalloutStyle -> RGBColor[0.97, 0.606, 0.081]]},
 ImageSize -> 400, PlotTheme -> "Business"]
Out[5]=
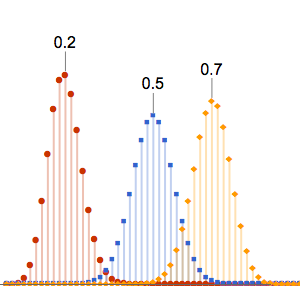
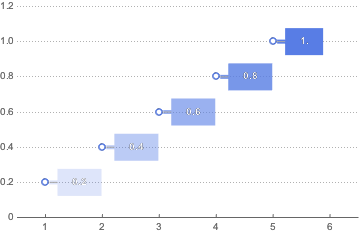
Укажите прозрачность фона.
In[6]:=
ListPlot[Table[
  Callout[n, ToString[n], Right, FrameMargins -> {15, 10},
   Background ->
    Directive[RGBColor[0.34398, 0.49112, 0.89936], Opacity[n]],
   LabelStyle -> Directive[Bold, White]], {n, .2, 1, .2}],
 ImageSize -> Medium, PlotRange -> {{.5, 6.5}, {0, 1.2}},
 PlotTheme -> "Business"]
Out[6]=
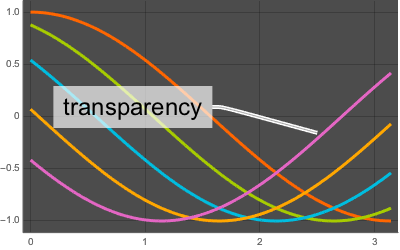
Выноски фона являются полупрозрачными по умолчанию для отображения лежащих в основе графиков.
In[7]:=
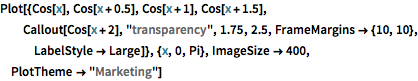
Plot[{Cos[x], Cos[x + 0.5], Cos[x + 1], Cos[x + 1.5],
  Callout[Cos[x + 2], "transparency", 1.75, 2.5,
   FrameMargins -> {10, 10}, LabelStyle -> Large]}, {x, 0, Pi},
 ImageSize -> 400, PlotTheme -> "Marketing"]
Out[7]=