Documentation de Wolfram Visualisation
Wolfram Visualisation fait partie intégrante de Wolfram Language. Le système complet contient plus de 6000 fonctions intégrées couvrant tous les domaines du calcul, toutes soigneusement intégrées pour fonctionner parfaitement ensemble.
Champ d'application et documentation
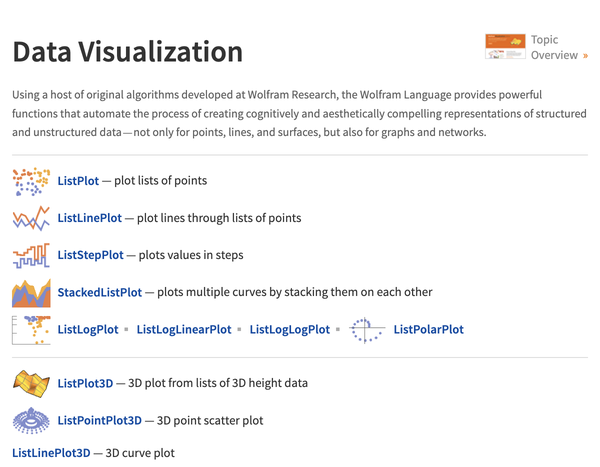
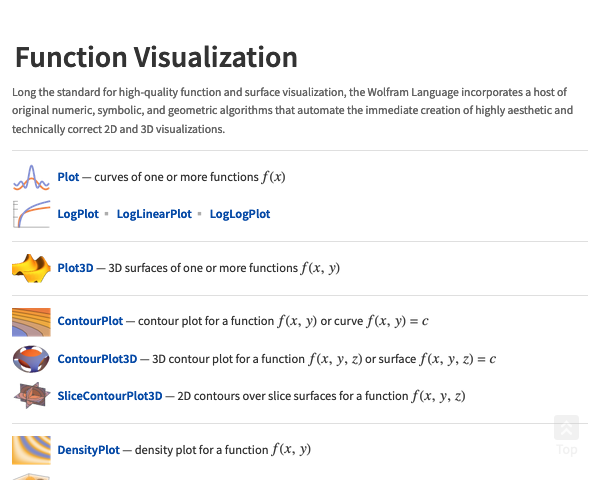
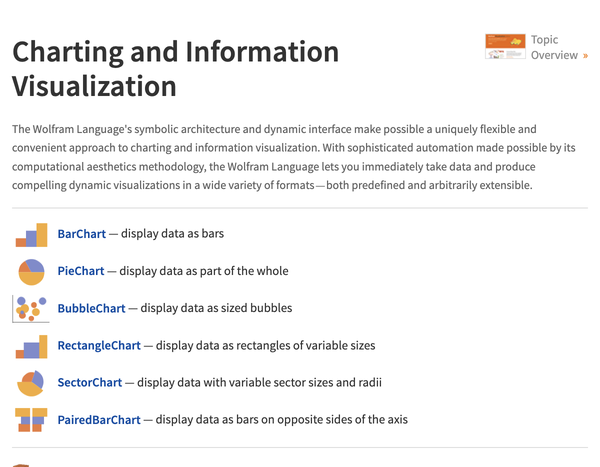
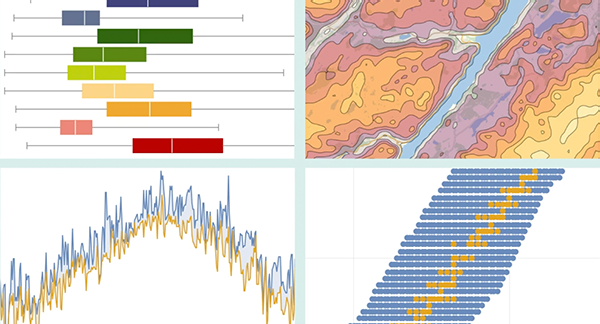
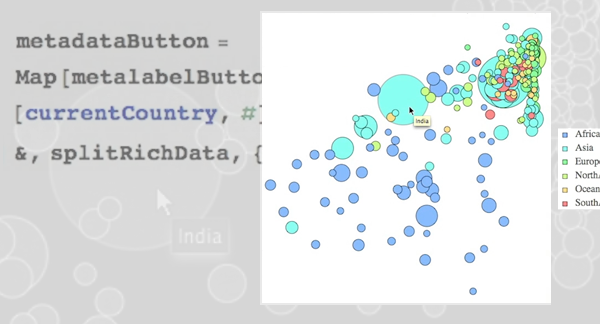
RectangleChart ▪ SectorChart ▪ PairedBarChart ▪ PieChart3D ▪ BubbleChart3D ▪ RectangleChart3D ▪ SectorChart3D ▪ SmoothHistogram ▪ CandlestickChart ▪ InteractiveTradingChart ▪ RenkoChart ▪ GeoBubbleChart ▪ Manipulate ▪ Animate ▪ TabView ▪ ChartLabels ▪ ChartLegends ▪ Placed ▪ LabelingFunction ▪ LegendAppearance ▪ Style ▪ ChartStyle ▪ BarOrigin ▪ SectorOrigin ▪ BarSpacing ▪ SectorSpacing ▪ ChartElements ▪ ChartElementFunction ▪ PopupWindow ▪ Button ▪ Hyperlink ▪ IconData ▪ Plot ▪ LogPlot ▪ LogLinearPlot ▪ LogLogPlot ▪ Plot3D ▪ ContourPlot ▪ ContourPlot3D ▪ SliceContourPlot3D ▪ DensityPlot ▪ DensityPlot3D ▪ SliceDensityPlot3D ▪ ParametricPlot ▪ ParametricPlot3D ▪ PolarPlot ▪ RevolutionPlot3D ▪ SphericalPlot3D ▪ RegionPlot ▪ RegionPlot3D ▪ ComplexPlot ▪ ComplexPlot3D ▪ ReImPlot ▪ AbsArgPlot ▪ DiscretePlot3D ▪ VectorPlot ▪ StreamPlot ▪ VectorPlot3D ▪ StreamPlot3D ▪ SliceVectorPlot3D ▪ ListPlot ▪ ListLinePlot ▪ ListStepPlot ▪ StackedListPlot ▪ ListLogPlot ▪ ListLogLinearPlot ▪ ListLogLogPlot ▪ ListPolarPlot ▪ ListPlot3D ▪ ListPointPlot3D ▪ ListLinePlot3D ▪ ListDensityPlot ▪ ListDensityPlot3D ▪ ListContourPlot ▪ ListContourPlot3D ▪ ListSliceDensityPlot3D ▪ ListSliceContourPlot3D ▪ ListCurvePathPlot ▪ ListSurfacePlot3D ▪ ArrayPlot ▪ ReliefPlot ▪ MatrixPlot ▪ ArrayPlot3D ▪ TernaryListPlot ▪ DateListPlot ▪ DateListLogPlot ▪ TimelinePlot ▪ DateHistogram ▪ DateListStepPlot ▪ StackedDateListPlot ▪ ListVectorPlot ▪ ListStreamPlot ▪ ListVectorPlot3D ▪ ListStreamPlot3D ▪ ListSliceVectorPlot3D ▪ BarChart ▪ PieChart ▪ BubbleChart ▪ BarChart3D ▪ Histogram ▪ Histogram3D ▪ QuantilePlot ▪ BoxWhiskerChart ▪ AngularGauge ▪ HorizontalGauge ▪ VerticalGauge ▪ RadialAxisPlot ▪ PairwiseListPlot ▪ FeatureSpacePlot ▪ GraphPlot ▪ LayeredGraphPlot ▪ TreePlot ▪ Dendrogram ▪ ClusteringTree ▪ Grid ▪ Row ▪ Column ▪ Multicolumn ▪ GraphicsGrid ▪ GraphicsRow ▪ WordCloud ▪ ImageCollage ▪ ImageAssemble ▪ GeoListPlot ▪ GeoSmoothHistogram ▪ GeoRegionValuePlot ▪ NumberLinePlot ▪ DiscretePlot ▪ AnatomyPlot3D ▪ WaveletScalogram ▪ WaveletListPlot ▪ WaveletMatrixPlot ▪ ChromaticityPlot ▪ ChromaticityPlot3D ▪ Frame ▪ PlotStyle ▪ Filling ▪ Mesh ▪ ImageSize ▪ PlotLabels ▪ Labeled ▪ Callout ▪ PlotLegends ▪ Legended ▪ LineLegend ▪ BarLegend ▪ Tooltip ▪ StatusArea ▪ Inset ▪ Around ▪ IntervalMarkers ▪