Amostragem de pontos em regiões
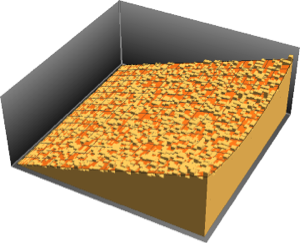
RandomPoint faz uma amostragem de pontos pseudo aleatórios definidos de forma uniforme em uma dada região.
In[1]:=
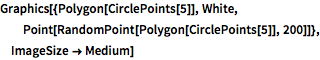
Graphics[{Polygon[CirclePoints[5]], White,
  Point[RandomPoint[Polygon[CirclePoints[5]], 200]]},
 ImageSize -> Medium]
Out[1]=
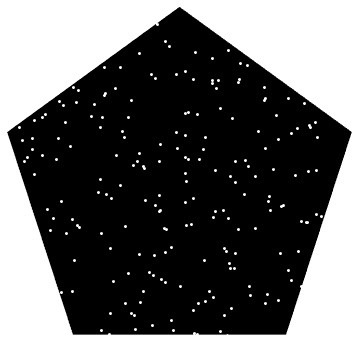
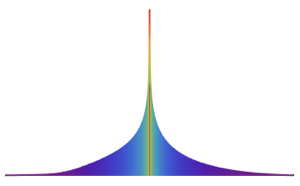
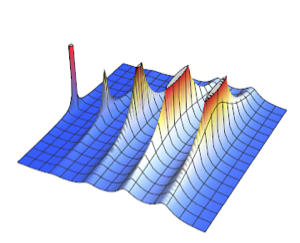
Crie uma amostra de pontos em uma região implícita de Lissajous.
In[2]:=
\[ScriptCapitalR] =
  ImplicitRegion[-1 + (-1 + 18 x^2 - 48 x^4 + 32 x^6)^2 + (-1 +
       18 y^2 - 48 y^4 + 32 y^6)^2 <= 0, {x, y}];
In[3]:=
Graphics[{PointSize[Tiny],
  Point[RandomPoint[\[ScriptCapitalR], 10^4]]}, ImageSize -> Medium]
Out[3]=

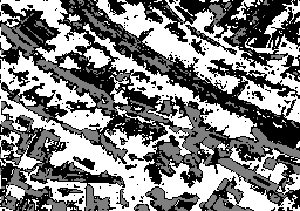
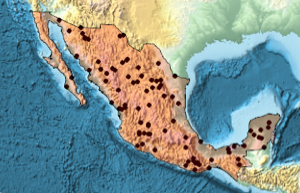
Crie amostras de pontos de um primitivo de Text.
In[4]:=
mr = DiscretizeGraphics[Text[Style["\[CapitalSigma]", Bold]], _Text,
   MaxCellMeasure -> 0.1];
In[5]:=
Graphics[{PointSize[Tiny], Point[RandomPoint[mr, 10000]]},
 ImageSize -> Medium]
Out[5]=

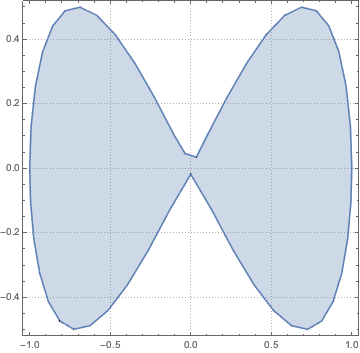
Use o método de Monte Carlo para aproximar uma integral com um domínio em uma região paramétrica.
In[6]:=
region = ParametricRegion[{{s, s t}, s^2 + t^2 <= 1}, {s, t}];mostre o input completo da Wolfram Language
Out[7]=
A função a ser integrada sobre o domínio.
In[8]:=
f[{x_, y_}] := x^3 - 2 x^2 y + 4 x^6 - y^5;
val = NIntegrate[f[{x, y}], {x, y} \[Element] region]
Out[8]=
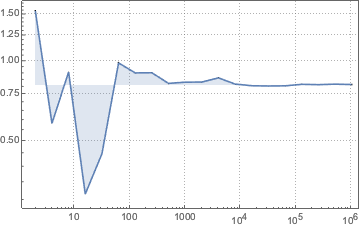
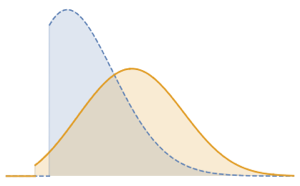
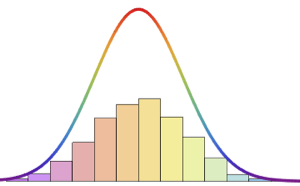
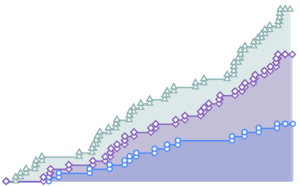
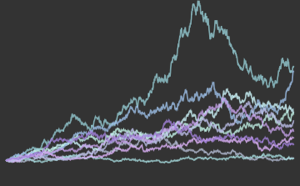
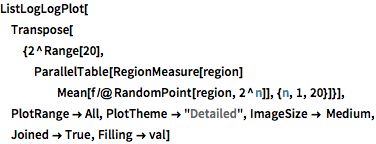
Visualize a convergência da estatística de Monte Carlo conforme o tamanho da amostra aumenta.
mostre o input completo da Wolfram Language
Out[9]=