수량 데이터에서 모수 추정
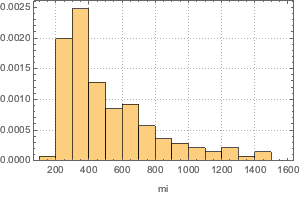
북미의 주요 하천 길이를 마일을 단위로하여 얻습니다.
In[1]:=
data = Quantity[ExampleData[{"Statistics", "RiverLengths"}], "Miles"];In[2]:=
h = Histogram[data, 30, PDF, Frame -> True, FrameLabel -> Automatic,
  PlotTheme -> "Detailed"]
Out[2]=

EstimatedDistribution은 수량 데이터를 받아들여 QuantityDistribution을 데이터의 단위와 함께 반환합니다.
In[3]:=
edist1 = EstimatedDistribution[data,
  InverseGammaDistribution[a, b, c, d]]
Out[3]=
다른 단위로 모델을 추정합니다.
In[4]:=
edist2 = EstimatedDistribution[data,
  QuantityDistribution[InverseGammaDistribution[a, b, c, d],
   "Kilometers"]]
Out[4]=
첫 번째 모델을 킬로미터로 변환합니다.
In[5]:=
UnitConvert[edist1, "Kilometers"]Out[5]=
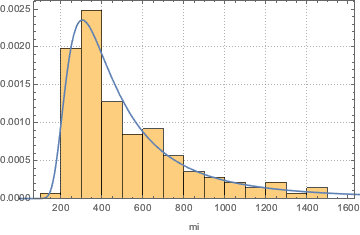
데이터 히스토그램을 피트 된 모델의 확률 밀도 함수와 함께 플롯합니다.
In[6]:=
Show[h, Plot[PDF[edist1, Quantity[x, "Miles"]], {x, 0, 2000}]]Out[6]=


