Modeling Floods with Pareto–Pickands Distribution
The data contains gauge levels from USGS 07010000 Mississippi River at St. Louis, MO over the period from 2007-10-01 to 2019-02-11, which is a relatively short time period in the study of floods. You can show how the Pareto–Pickands distribution can be used to model the tail of this data.
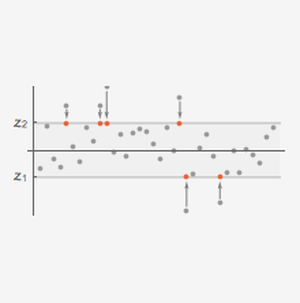
Find the top 20% level and select the largest values.
Plot the tails against the whole dataset.
Fit the Pareto–Pickands distribution to the tail of the data.
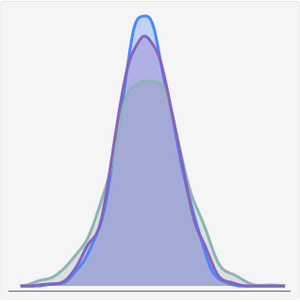
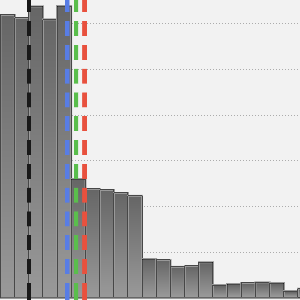
Compare the histogram of the data tail with the PDF of the estimated distribution.
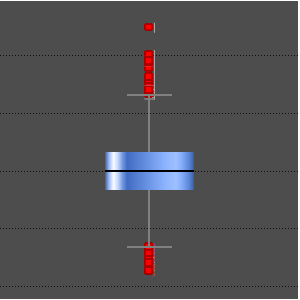
Use QuantilePlot to asses the goodness of fit.