Example Images
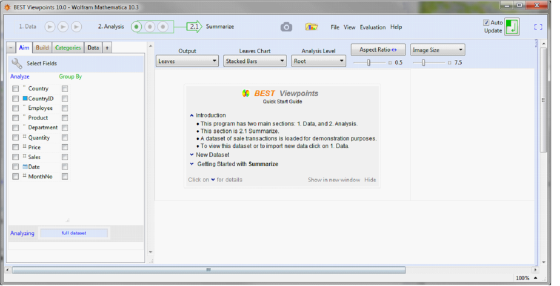
Welcome Screen
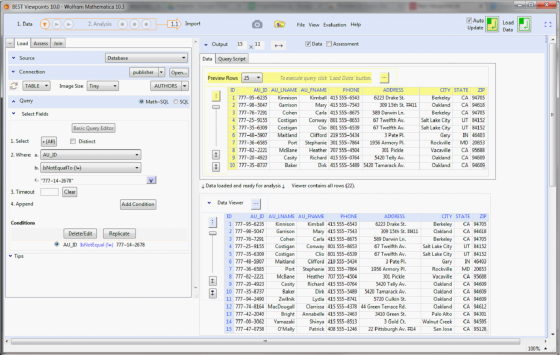
Reading Data from Databases
Section 2.1 Summarize
Section 2.1 Summarize: Total Sales on Stacked Charts
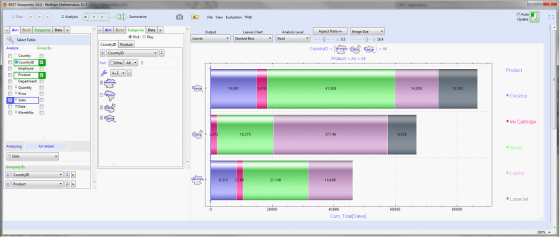
Section 2.1 Summarize: Total Sales on Stacked Charts—Four
Categorical Variables
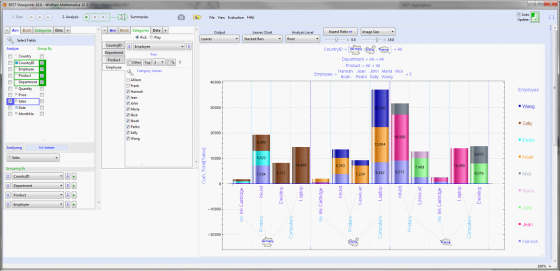
Section 2.1 Summarize: Total Sales on Tree
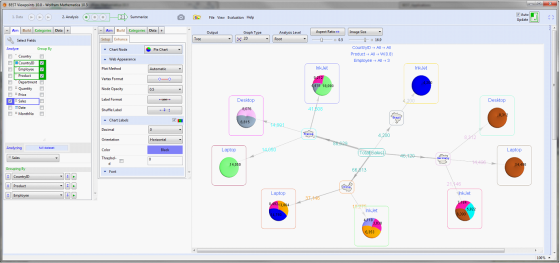
Section 2.1 Summarize: Tree—Creating and Using Analysis Templates
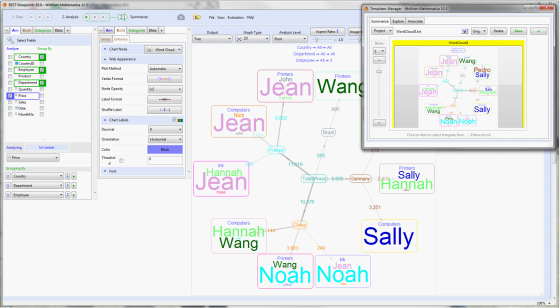
Section 2.2 Explore
Section 2.2 Explore: Bundle
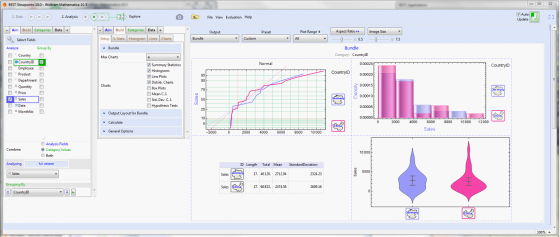
Section 2.2 Explore: Data Trimming and Scatter Plots
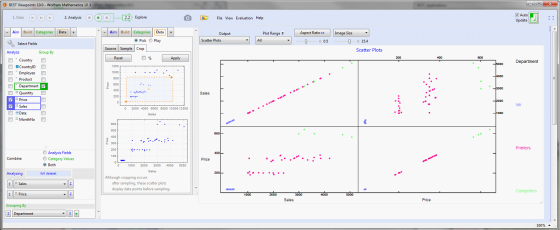
Section 2.2 Explore: SPC
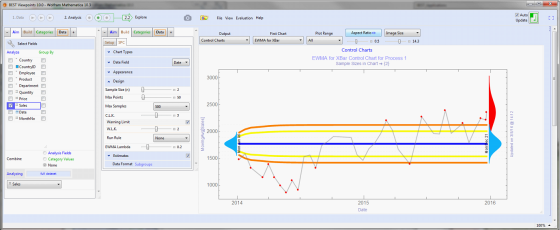
Section 2.2 Explore: Data Models
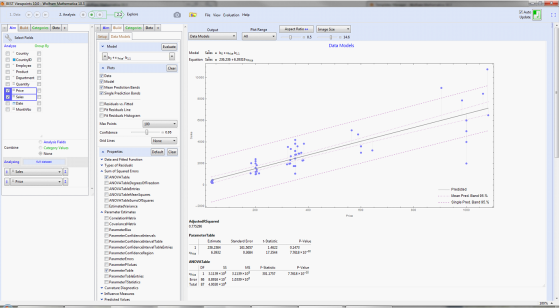
Section 2.3 Associate
Section 2.3 Associate: Market Basket Analysis
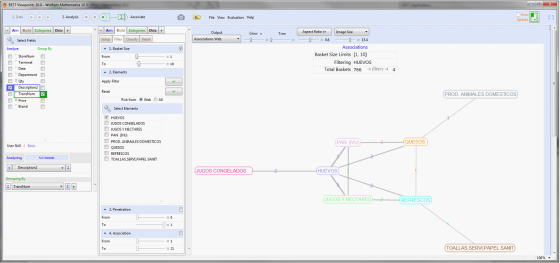
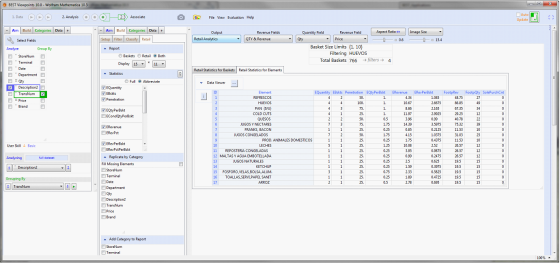
Section 2.3 Associate: Retail Analytics
| 


