Anote pontos de forma programática
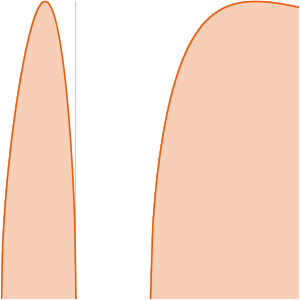
Faça dois gráficos com os mesmos dados com diferentes funções de anotação.
In[1]:=

Grid[Partition[
  Table[ListLinePlot[Prime[Range[10]], LabelingFunction -> functions,
    ImageSize -> 250, Filling -> Axis,
    PlotTheme -> "Web"], {functions, {(#1 &), (First@#2 &)}}], 2]]
Out[1]=


